DAX Essentials
DAX is Power BI's formula language. The #1 thing to understand is filter context — every DAX expression is evaluated within a set of active filters. CALCULATE is the most important function because it lets you override filter context. Master these and you can build any KPI.
Explain Like I'm 12
Imagine a magic calculator. When someone asks "What's the total sales?", the calculator looks at which filters are active (which year? which region? which product?) and gives you the answer for just that slice.
CALCULATE is like telling the calculator: "I know the current filters, but I want you to pretend we're also looking at last year." It changes what the calculator sees before it does the math.
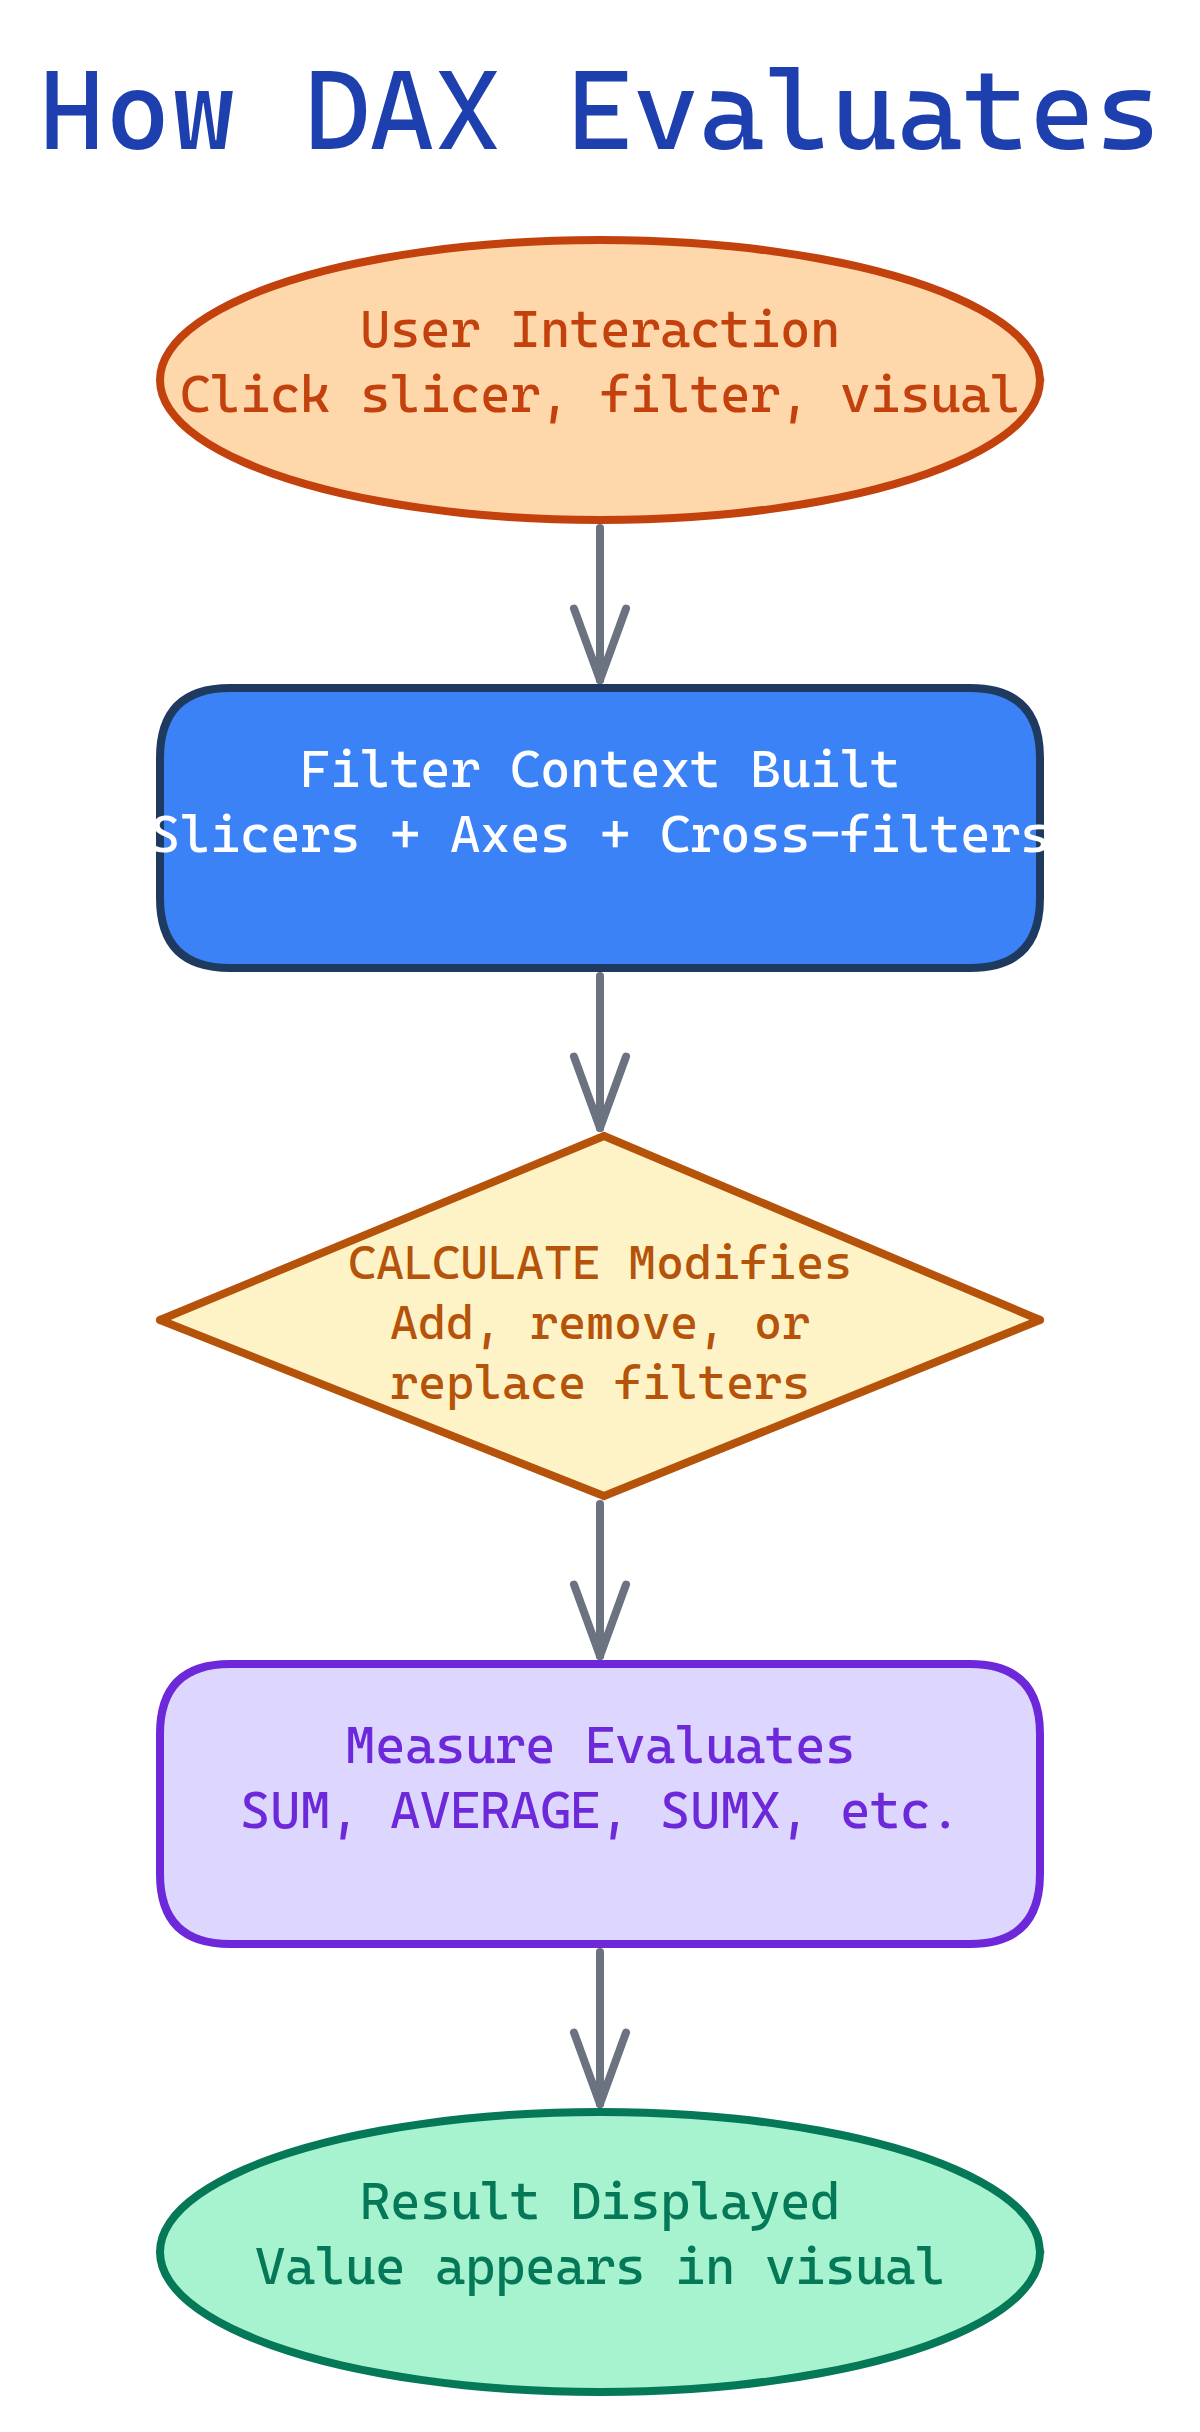
How DAX Evaluates
Filter Context (The #1 Concept)
Every time a DAX measure is evaluated, it runs inside a filter context — the set of filters that determine which rows of data are visible.
Filter context comes from:
- Slicers — user picks "2025" from a year slicer
- Visual axes — a bar chart's X-axis creates one context per bar
- Cross-filtering — clicking a bar in one chart filters other charts
- Report/page filters — applied in the Filters pane
- CALCULATE() — programmatically adds or overrides filters
// This measure respects whatever filter context is active
Total Sales = SUM(Sales[Amount])

// In a matrix with Year on rows and Category on columns:
// Cell "2024 / Electronics" evaluates as:
// SUM of Sales[Amount] WHERE Year=2024 AND Category=Electronics
CALCULATE — The Most Important Function
CALCULATE evaluates an expression in a modified filter context. It's what makes DAX powerful.
CALCULATE( expression, filter1, filter2, ... )Common Patterns
// Override a filter: sales for Electronics regardless of slicer
Electronics Sales = CALCULATE([Total Sales], Products[Category] = "Electronics")

// Remove a filter: total across ALL categories (ignores category slicer)
All Category Sales = CALCULATE([Total Sales], ALL(Products[Category]))

// Add a filter: sales where quantity > 10
Big Orders = CALCULATE([Total Sales], Sales[Quantity] > 10)

// Combine: percentage of total
% of Total = DIVIDE([Total Sales], CALCULATE([Total Sales], ALL(Products)))CALCULATE([Total Sales], Products[Category] = "Electronics") replaces the current category filter with "Electronics". If a slicer had "Clothing" selected, CALCULATE overrides it. Use KEEPFILTERS() to intersect instead of replace.
Measures vs Calculated Columns
| Aspect | Measure | Calculated Column |
|---|---|---|
| Evaluated | At query time (dynamic) | At refresh time (static) |
| Storage | No storage (computed on the fly) | Stored in the table |
| Context | Respects filter context | Row context only |
| Can use in slicer | No | Yes |
| Use for | Aggregations, KPIs, ratios | Row-level categorization, flags |
// MEASURE: Total sales (dynamic, changes with filters)
Total Sales = SUM(Sales[Amount])

// CALCULATED COLUMN: Price tier (static, one value per row)
Price Tier = IF(Products[Price] > 100, "Premium", "Standard")Time Intelligence
DAX has built-in functions for year-over-year, month-to-date, running totals, and more. They all require a date table marked as a date table in the model.
// Year-to-Date
YTD Sales = TOTALYTD([Total Sales], Calendar[Date])

// Same period last year
Sales Last Year = CALCULATE([Total Sales], SAMEPERIODLASTYEAR(Calendar[Date]))

// Year-over-Year change
YoY Change =
  VAR Current = [Total Sales]
  VAR Prior = [Sales Last Year]
  RETURN DIVIDE(Current - Prior, Prior)

// Running total
Running Total = CALCULATE(
  [Total Sales],
  FILTER(ALL(Calendar[Date]), Calendar[Date] <= MAX(Calendar[Date]))
)

// Moving average (3-month)
3M Avg = AVERAGEX(
  DATESINPERIOD(Calendar[Date], MAX(Calendar[Date]), -3, MONTH),
  [Total Sales]
)Iterator Functions (The X Functions)
Functions ending in X (SUMX, AVERAGEX, MINX, MAXX, COUNTX, RANKX) iterate row by row over a table, evaluate an expression per row, then aggregate.
// SUM: adds a column directly
Total Revenue = SUM(Sales[Amount])

// SUMX: evaluates an expression per row, then sums
Total Revenue = SUMX(Sales, Sales[Quantity] * Sales[UnitPrice])

// Weighted average (can't do with plain AVERAGE)
Weighted Avg Price = DIVIDE(
  SUMX(Sales, Sales[Quantity] * Sales[UnitPrice]),
  SUM(Sales[Quantity])
)

// Rank products by sales
Product Rank = RANKX(ALL(Products), [Total Sales], , DESC, DENSE)Variables (VAR / RETURN)
Variables make DAX readable and performant. A variable is evaluated once and reused.
Profit Margin =
  VAR TotalRevenue = [Total Sales]
  VAR TotalCost = SUM(Sales[Cost])
  VAR Profit = TotalRevenue - TotalCost
RETURN DIVIDE(Profit, TotalRevenue)Essential Functions Cheat Sheet
| Category | Functions |
|---|---|
| Aggregation | SUM, AVERAGE, MIN, MAX, COUNT, DISTINCTCOUNT |
| Iterators | SUMX, AVERAGEX, MINX, MAXX, COUNTX, RANKX |
| Filter modification | CALCULATE, CALCULATETABLE, ALL, ALLEXCEPT, FILTER, KEEPFILTERS |
| Time intelligence | TOTALYTD, TOTALQTD, TOTALMTD, SAMEPERIODLASTYEAR, DATESINPERIOD, PARALLELPERIOD |
| Table functions | FILTER, VALUES, DISTINCT, ADDCOLUMNS, SUMMARIZE, TOPN |
| Logic | IF, SWITCH, AND, OR, NOT, COALESCE, BLANK |
| Text | CONCATENATE, FORMAT, LEFT, RIGHT, MID, SEARCH, SUBSTITUTE |
| Relationships | RELATED, RELATEDTABLE, USERELATIONSHIP, CROSSFILTER |
Test Yourself
Q: What is filter context?
Q: What does CALCULATE do?
Q: When should you use SUMX instead of SUM?
SUMX(Sales, Sales[Qty] * Sales[Price]) multiplies per row then sums. SUM can only add an existing column directly.Q: Why use VAR in DAX?
Interview Questions
Q: Explain the difference between row context and filter context.
Q: What is context transition in DAX?
Q: Write a DAX measure for % of parent total (e.g., each product's share within its category).
% of Category =
  DIVIDE(
    [Total Sales],
    CALCULATE([Total Sales], ALLEXCEPT(Products, Products[Category]))
  )
ALLEXCEPT removes all filters on Products except Category, giving the category total as the denominator.
Q: How would you create a measure that shows the top 3 products by sales?
Top 3 Sales = CALCULATE(
  [Total Sales],
  TOPN(3, ALL(Products[ProductName]), [Total Sales], DESC)
)
TOPN returns a table of the top 3 product names by sales. CALCULATE uses this as a filter.
Q: What is the difference between ALL() and REMOVEFILTERS()?