Core Concepts of Power BI
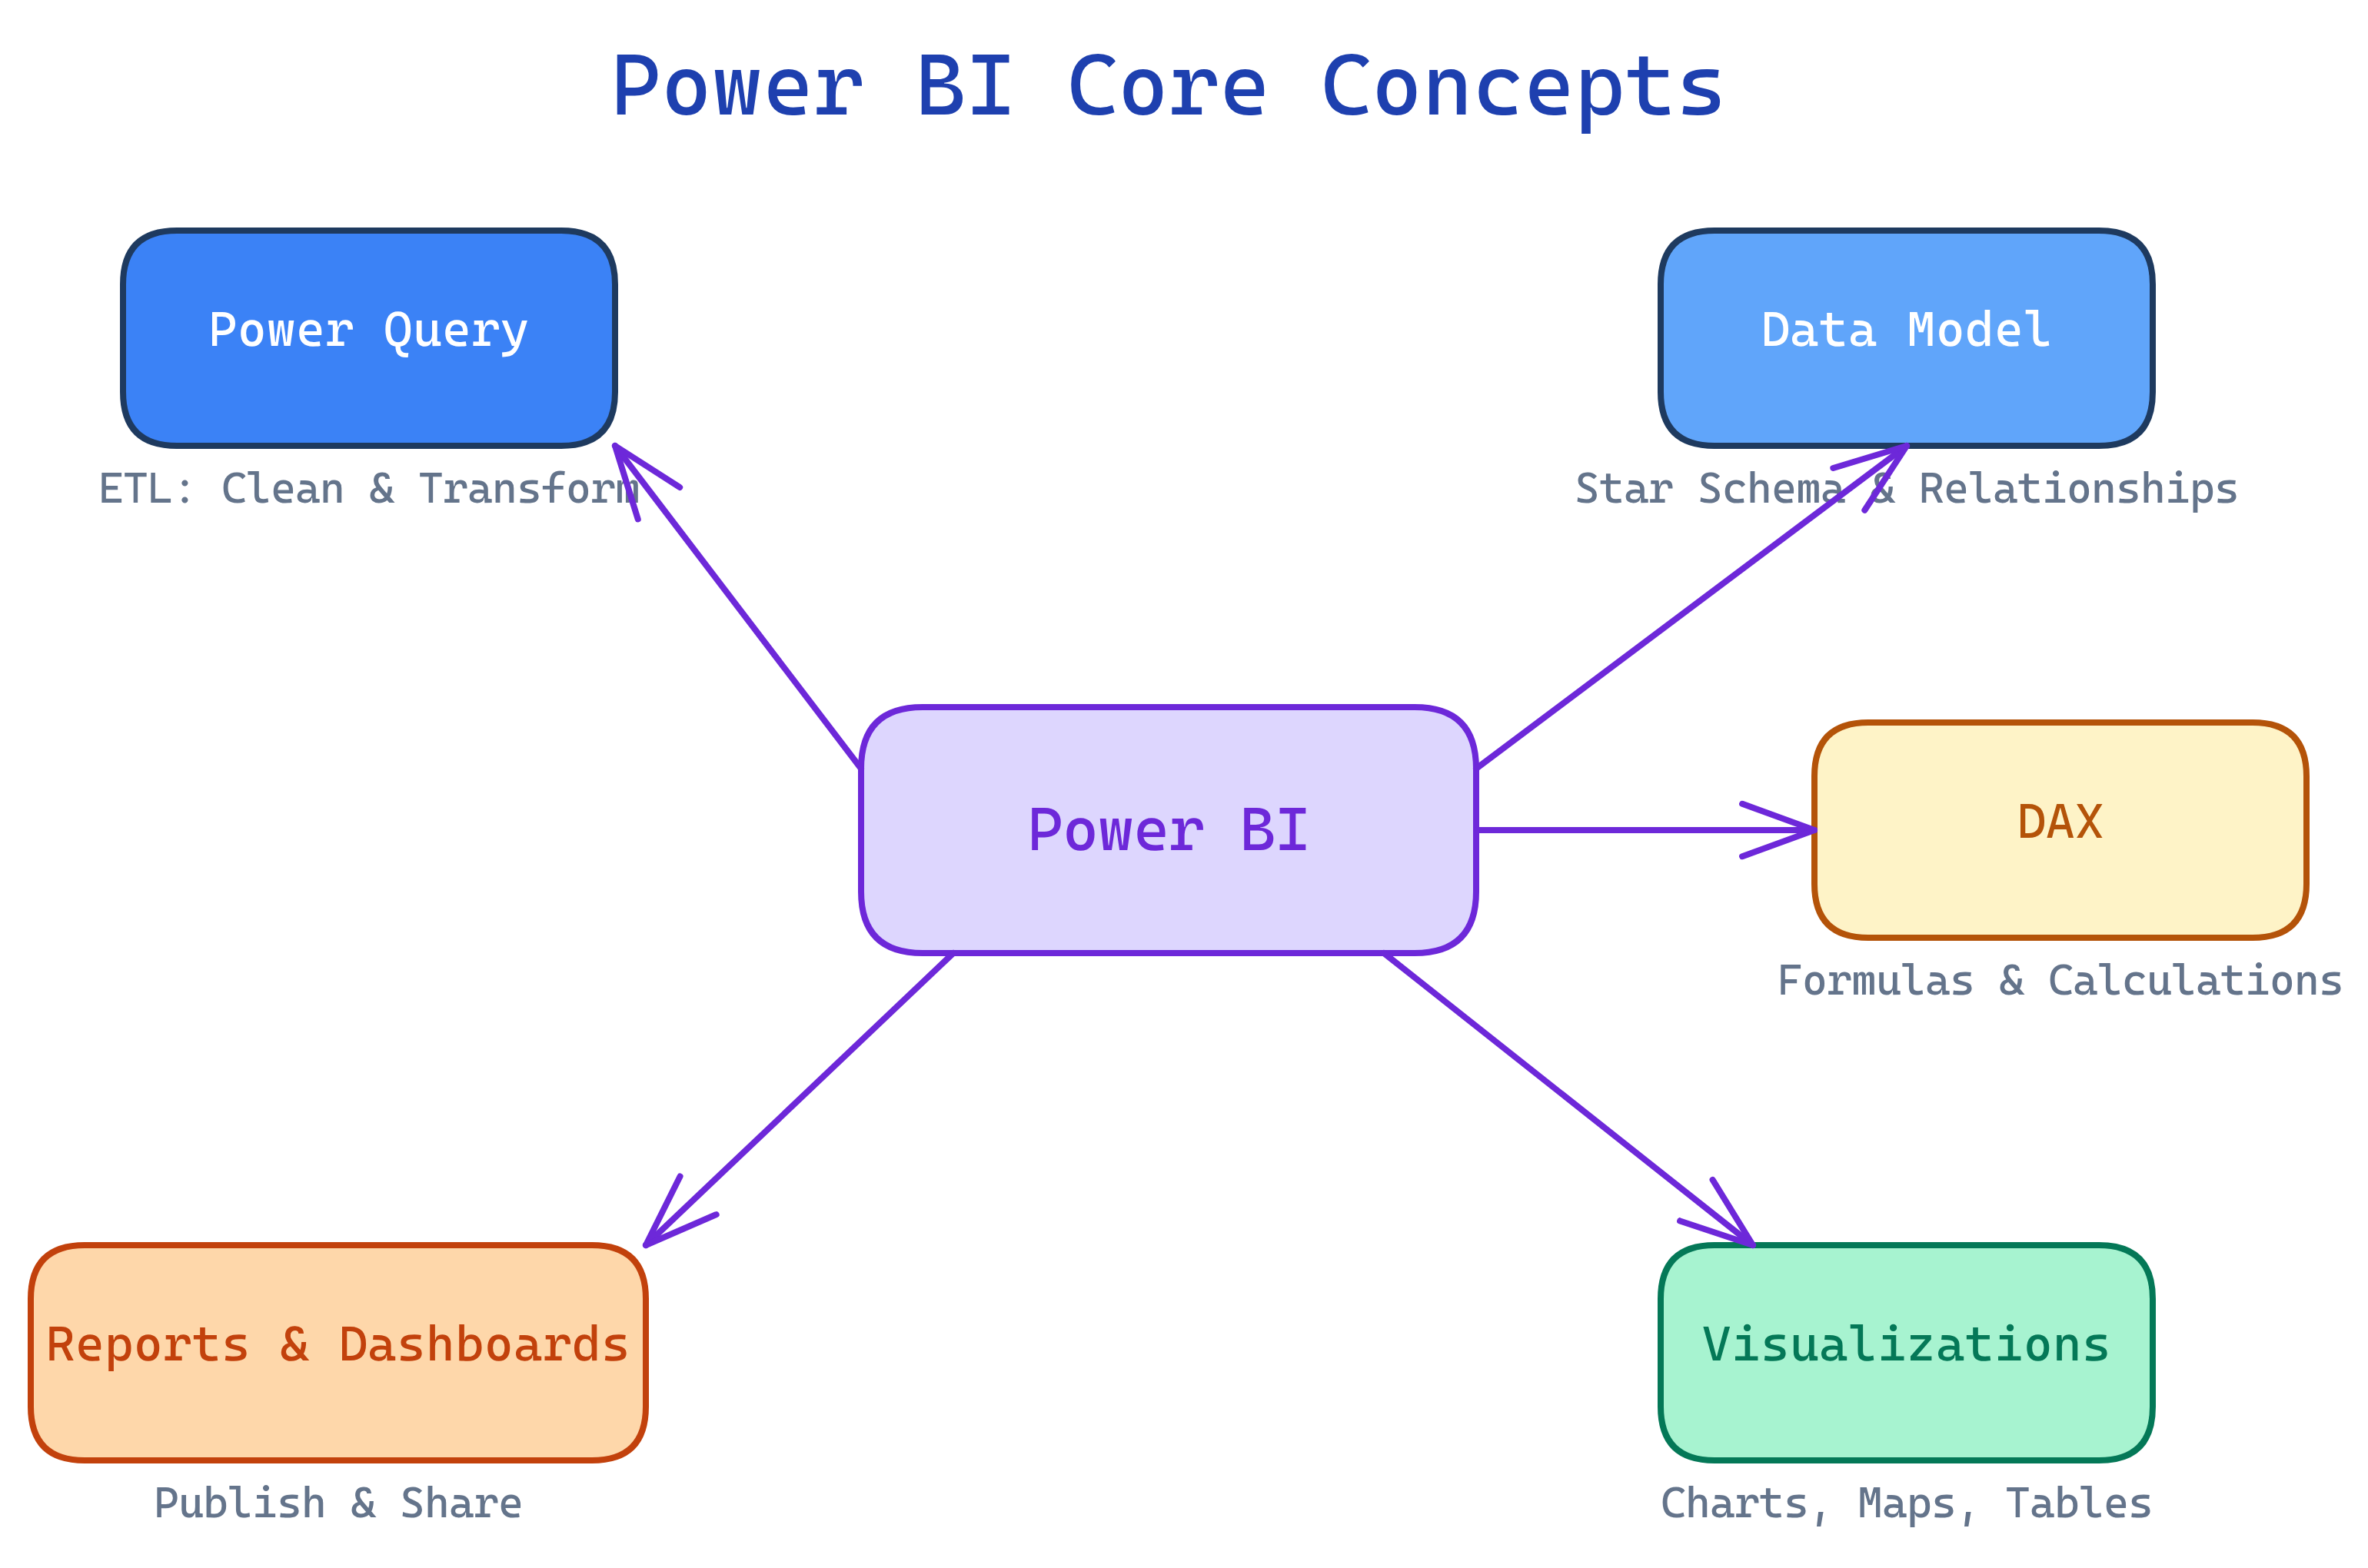
Power BI has 5 building blocks: Power Query (clean data), Data Model (relate tables), DAX (calculations), Visualizations (charts), and Reports & Dashboards (share insights). Data flows left to right through this pipeline.
The Big Picture
Every Power BI project follows the same pipeline. Data enters on the left, insights come out on the right.
Explain Like I'm 12
Cheat Sheet
| Concept | What It Does | Where in Desktop |
|---|---|---|
| Power Query | Connect, clean, transform data | Home → Transform Data |
| Data Model | Define table relationships | Model view (left sidebar) |
| DAX | Write formulas for measures and columns | Modeling tab → New Measure |
| Visualizations | Drag fields onto chart types | Report view (canvas) |
| Report / Dashboard | Multi-page report; single-page dashboard | Desktop / Service |
The 5 Building Blocks
Power Query — Clean Your Data
Power Query is the ETL engine (Extract, Transform, Load) of Power BI. Before data hits your model, it passes through Power Query where you clean it up.
Common transformations:
- Remove columns — drop what you don't need
- Filter rows — remove nulls, errors, or irrelevant records
- Change types — fix dates that loaded as text, numbers as strings
- Merge queries — like a SQL JOIN between two tables
- Append queries — like UNION ALL, stacking rows from multiple tables
- Pivot / Unpivot — reshape data between wide and tall formats
- Add custom columns — computed columns using the M language
Data Model — Relate Your Tables
The data model defines how your tables connect. This is where Power BI becomes more than just charts — it becomes a relational analytics engine.
Star Schema (The Gold Standard)
The best data models follow the star schema pattern:
- Fact table (center) — contains the numbers you measure (sales amount, quantity, revenue). Usually the largest table.
- Dimension tables (around it) — contain the things you filter/slice by (date, product, customer, region). Usually smaller.
- Relationships — one-to-many from dimension to fact (e.g., one product appears in many sales rows)
Key Concepts
| Term | Meaning |
|---|---|
| Cardinality | 1:1, 1:*, *:* — how many rows match between tables |
| Cross-filter direction | Single (dimension filters fact) or Both (bidirectional) — prefer Single |
| Active relationship | The default relationship used for filtering (only one active per pair) |
| Inactive relationship | Exists but not used unless activated with USERELATIONSHIP() in DAX |
DAX — Write Calculations
DAX (Data Analysis Expressions) is the formula language for Power BI. It looks like Excel formulas but works on entire tables and columns, not individual cells.
Two types of DAX calculations:
| Type | When evaluated | Where stored | Use for |
|---|---|---|---|
| Measure | At query time (dynamic) | In the model, not in a column | Aggregations, KPIs, dynamic calculations |
| Calculated Column | At refresh time (static) | As a new column in the table | Row-level calculations, categorization |
// Measure: Total Sales
Total Sales = SUM(Sales[Amount])

// Measure: Year-over-Year Growth
YoY Growth =
  VAR CurrentYear = [Total Sales]
  VAR PriorYear = CALCULATE([Total Sales], SAMEPERIODLASTYEAR(Calendar[Date]))
RETURN DIVIDE(CurrentYear - PriorYear, PriorYear)Visualizations — Show the Story
Drag fields onto visuals to create charts. Power BI auto-aggregates measures and filters dimensions.
| Visual Type | Best For |
|---|---|
| Bar / Column chart | Comparing categories |
| Line chart | Trends over time |
| Pie / Donut chart | Part-of-whole (use sparingly) |
| Card / KPI | Single number or target vs actual |
| Table / Matrix | Detailed data, drill-down |
| Map | Geographic data |
| Slicer | Interactive filter controls |
| Scatter chart | Correlation between two measures |
Reports & Dashboards — Share Insights
| Feature | Report | Dashboard |
|---|---|---|
| Created in | Power BI Desktop | Power BI Service |
| Pages | Multiple pages | Single page |
| Data source | One dataset | Visuals pinned from many reports |
| Interactivity | Full (slicers, drill-through, cross-filter) | Click-to-navigate only |
| Best for | Deep analysis and exploration | At-a-glance KPI monitoring |
Workflow: Build a report in Desktop → Publish to Service → Pin key visuals to a Dashboard → Share the dashboard with stakeholders.
Test Yourself
Q: What does Power Query do in the Power BI pipeline?
Q: What is a star schema?
Q: What is the difference between a measure and a calculated column?
Q: Why should you do data cleaning in Power Query instead of DAX?
Interview Questions
Q: Explain the difference between Import and DirectQuery mode.
Q: What is filter context in DAX?
Q: What is a gateway in Power BI?
Q: How would you optimize a slow Power BI report?