What is Power BI?
Power BI is Microsoft's business intelligence platform. You connect to data sources, clean and shape the data with Power Query, build a data model with relationships, write DAX formulas for calculations, and create interactive reports and dashboards you can share with anyone.
The Big Picture
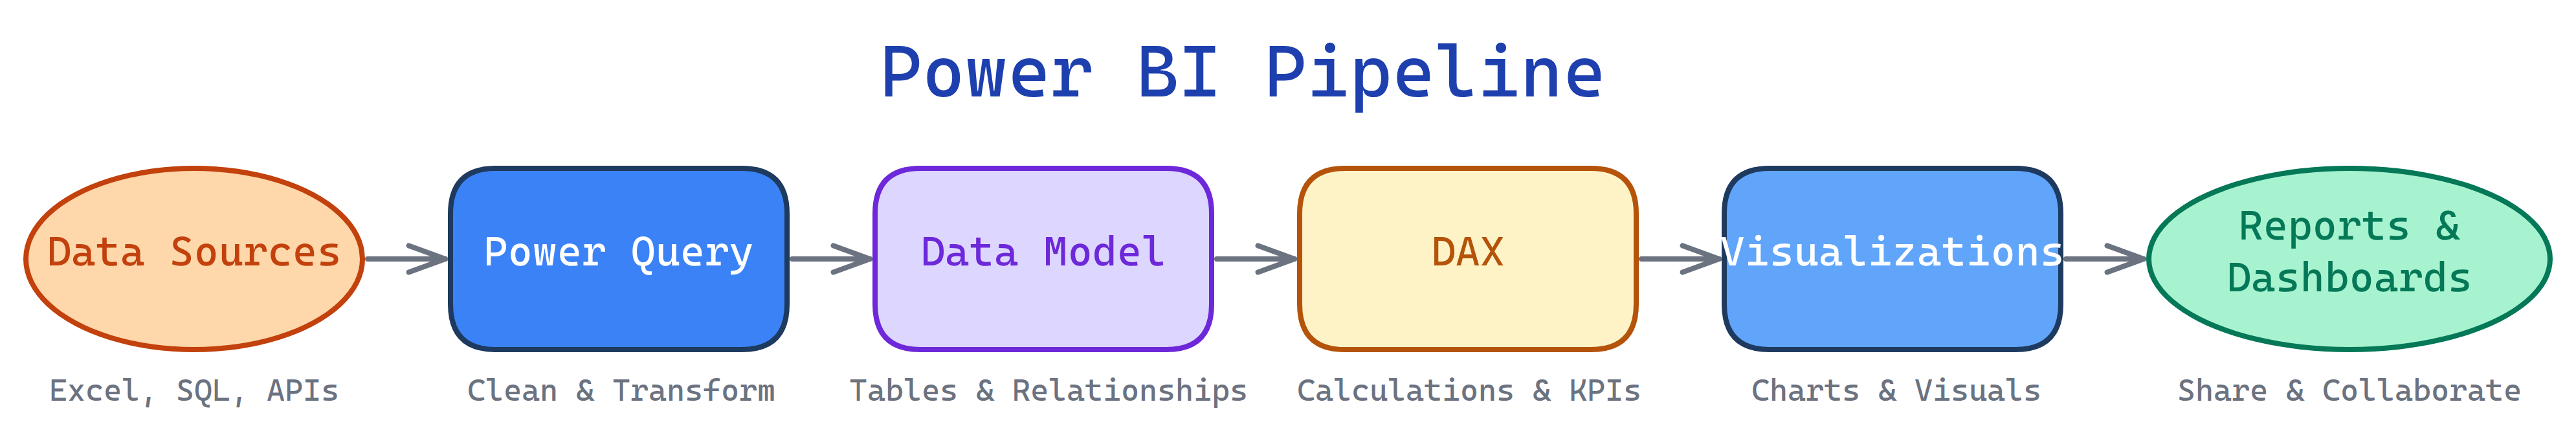
Power BI turns raw data into decisions. Here's the full pipeline:
Explain Like I'm 12
Imagine you have a messy pile of report cards, attendance sheets, and test scores from every student in your school. Power BI is like a super-organized friend who:
- Grabs all the papers (connects to data sources)
- Cleans them up (Power Query removes junk, fixes typos)
- Staples related sheets together (Data Model links tables)
- Does the math (DAX calculates averages, totals, rankings)
- Makes colorful charts (Visualizations)
- Pins them to the hallway bulletin board (Publishes to Power BI Service)
Now anyone can walk by and instantly see which class has the highest average, which students improved, and which subjects need help — all from one glance.
What is Power BI?
Power BI is a suite of tools by Microsoft for business intelligence — the art of turning raw data into actionable insights. It launched in 2015 and has grown into one of the most widely used BI tools in the world, used by everyone from solo analysts to Fortune 500 companies.
It comes in three flavors:
Who is it for?
Anyone who works with data and needs to make it understandable. Data analysts build reports. Business users consume dashboards. Finance teams track KPIs. HR monitors headcount. Marketing measures campaign performance. If your job involves decisions based on data, Power BI is for you.
What can Power BI do?
- Connect to 100+ data sources — Excel, SQL Server, PostgreSQL, Salesforce, Google Analytics, REST APIs, and more
- Clean and transform data — Power Query's no-code/low-code editor fixes messy data without writing SQL
- Build data models — define relationships between tables like a relational database
- Write calculations with DAX — a formula language for aggregations, time intelligence, and custom KPIs
- Create interactive visualizations — bar charts, line charts, maps, tables, KPI cards, and 200+ custom visuals
- Publish and share — one-click publish to the cloud, share with colleagues, embed in websites
- Schedule data refreshes — reports update automatically on a schedule
- Row-level security — control who sees what data based on their role
Power BI vs Others
| Feature | Power BI | Tableau | Excel |
|---|---|---|---|
| Price | Free desktop; $10/user/mo Pro | $75/user/mo | Part of Office |
| Learning curve | Moderate | Steep | Low |
| Data size | Millions of rows | Millions of rows | ~1M rows max |
| Formula language | DAX | Calculated fields | Excel formulas |
| Collaboration | Power BI Service | Tableau Server | SharePoint/OneDrive |
| Best for | Microsoft ecosystem teams | Advanced visual analytics | Quick ad-hoc analysis |
What you'll learn
Test Yourself
What are the three components of Power BI?
What is DAX?
What does Power Query do?
How is Power BI different from Excel for data analysis?