Python for Data Analytics
Python is the #1 language for data analytics. The core stack: Pandas (data manipulation), NumPy (math), Matplotlib/Seaborn (visualization), and Jupyter (interactive notebooks). If you know SQL, you can learn Pandas in a weekend.
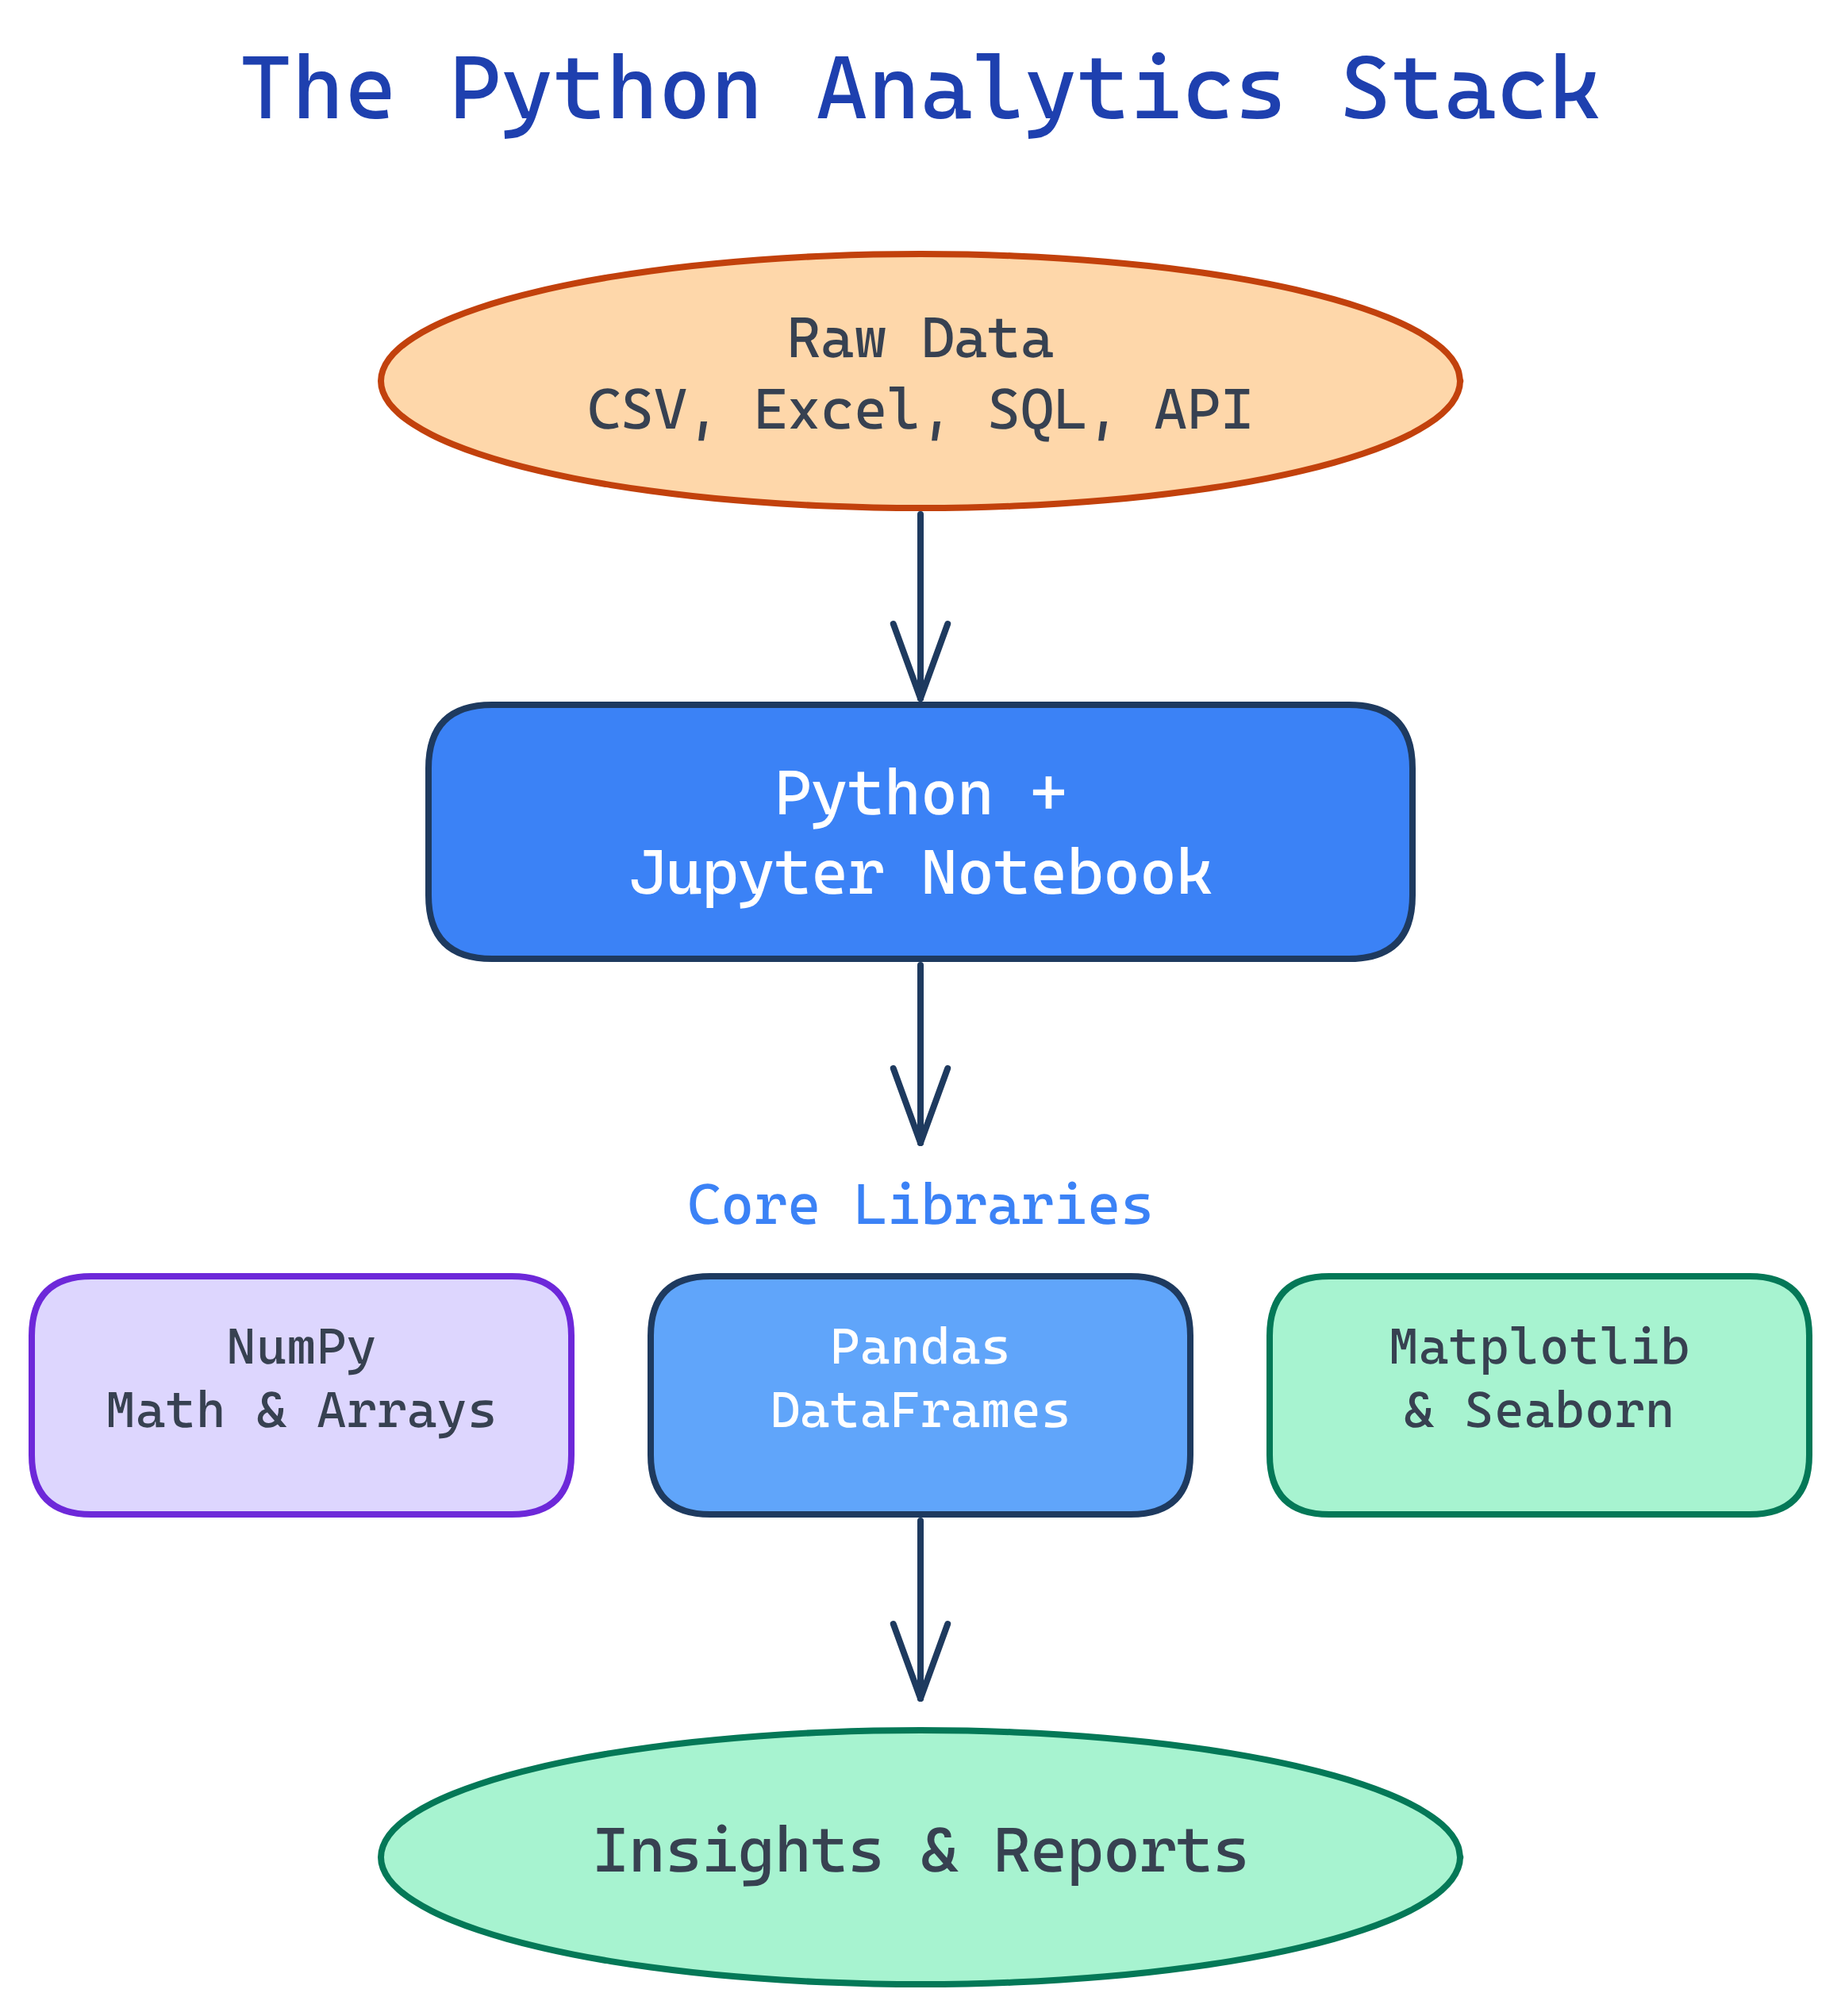
The Big Picture
Python's analytics ecosystem is a stack of libraries that work together. Here's how they fit:
Explain Like I'm 12
Pandas is like Excel but supercharged — imagine Excel with 10 million rows, no lag, and a formula bar that speaks Python. NumPy is the calculator behind the scenes doing all the math. Matplotlib draws the charts. Seaborn makes those charts prettier. And Jupyter is the notebook where you write it all down and see results instantly — like a science lab notebook that runs your experiments for you.
What is Python for Data Analytics?
"Python for Data Analytics" isn't a single tool — it's a stack of five open-source libraries that turn Python into the world's most popular data analysis platform. Each library handles one job, and they snap together like LEGO:
- Jupyter Notebooks — Your workspace. Write code, see results, add notes, all in your browser.
- NumPy — The math engine. Fast arrays and vectorized operations that power everything else.
- Pandas — The star of the show. DataFrames for loading, cleaning, filtering, grouping, and merging data.
- Matplotlib — The charting foundation. Line charts, bar charts, scatter plots, subplots.
- Seaborn — Statistical visualization. Beautiful histograms, box plots, heatmaps with one line of code.
If you already know SQL, the transition to Pandas is surprisingly smooth. Most SQL operations have a direct Pandas equivalent — the syntax just looks different.
Who is it for?
This topic is for anyone who works with data and wants to go beyond Excel and SQL. Whether you're a data analyst building reports, a BI developer doing ad-hoc analysis, a data engineer scripting ETL pipelines, or an Excel power user who's hit the row limit — Python is your next tool.
You don't need to be a software developer. If you can write a SQL query or an Excel formula, you can learn Pandas. The syntax is different, but the thinking is the same: filter rows, pick columns, group data, calculate totals.
SQL vs Pandas — A Quick Comparison
If you already know SQL, this table is your Rosetta Stone. Every SQL operation has a Pandas equivalent:
| SQL | Pandas | What It Does |
|---|---|---|
SELECT col1, col2 |
df[["col1", "col2"]] |
Pick specific columns |
WHERE col > 100 |
df.query("col > 100") |
Filter rows by condition |
GROUP BY col |
df.groupby("col") |
Group rows for aggregation |
ORDER BY col DESC |
df.sort_values("col", ascending=False) |
Sort rows |
JOIN ... ON |
pd.merge(df1, df2, on="key") |
Combine two tables on a key |
COUNT(*), SUM(col) |
df["col"].count(), df["col"].sum() |
Aggregate functions |
DISTINCT |
df["col"].unique() |
Get unique values |
LIMIT 10 |
df.head(10) |
First N rows |
The Analytics Stack
Each tool in the Python analytics stack handles one layer of the workflow:
What You'll Learn
This topic walks you through the entire Python analytics stack from fundamentals to deep dives:
Test Yourself
What are the 5 core libraries in the Python analytics stack?
How would you select rows where the "amount" column is greater than 100 in Pandas?
df.query("amount > 100") or boolean indexing: df[df["amount"] > 100]. This is the Pandas equivalent of SQL's WHERE amount > 100.What is the Pandas equivalent of SQL's GROUP BY?
df.groupby("column") followed by an aggregation like .mean(), .sum(), or .count(). For example, df.groupby("payer")["amount"].mean() is equivalent to SELECT payer, AVG(amount) FROM df GROUP BY payer.Why is Pandas faster than doing the same work in Excel?