Data Marts & Analytics
Tuva includes 13+ pre-built data marts: CMS-HCCs (risk adjustment), HEDIS/Quality Measures, Readmissions, Financial PMPM, Chronic Conditions, ED Classification, Pharmacy, Provider Attribution, AHRQ measures, CCSR, and more. Each mart produces analytics-ready tables that plug directly into BI tools.
Explain Like I'm 12
Imagine you want to build a Lego castle, but instead of starting with a pile of random bricks, someone gives you pre-built walls, towers, and gates. That's what data marts are. Instead of writing complex SQL from scratch every time you need an analytics report, Tuva gives you ready-made analytics tables that are already assembled from the raw data.
Each data mart is like a different section of the castle — one handles costs, another tracks quality scores, another flags patients who might get readmitted to the hospital. You just pick the ones you need and connect them to your dashboard tool.
Tuva Data Marts Architecture
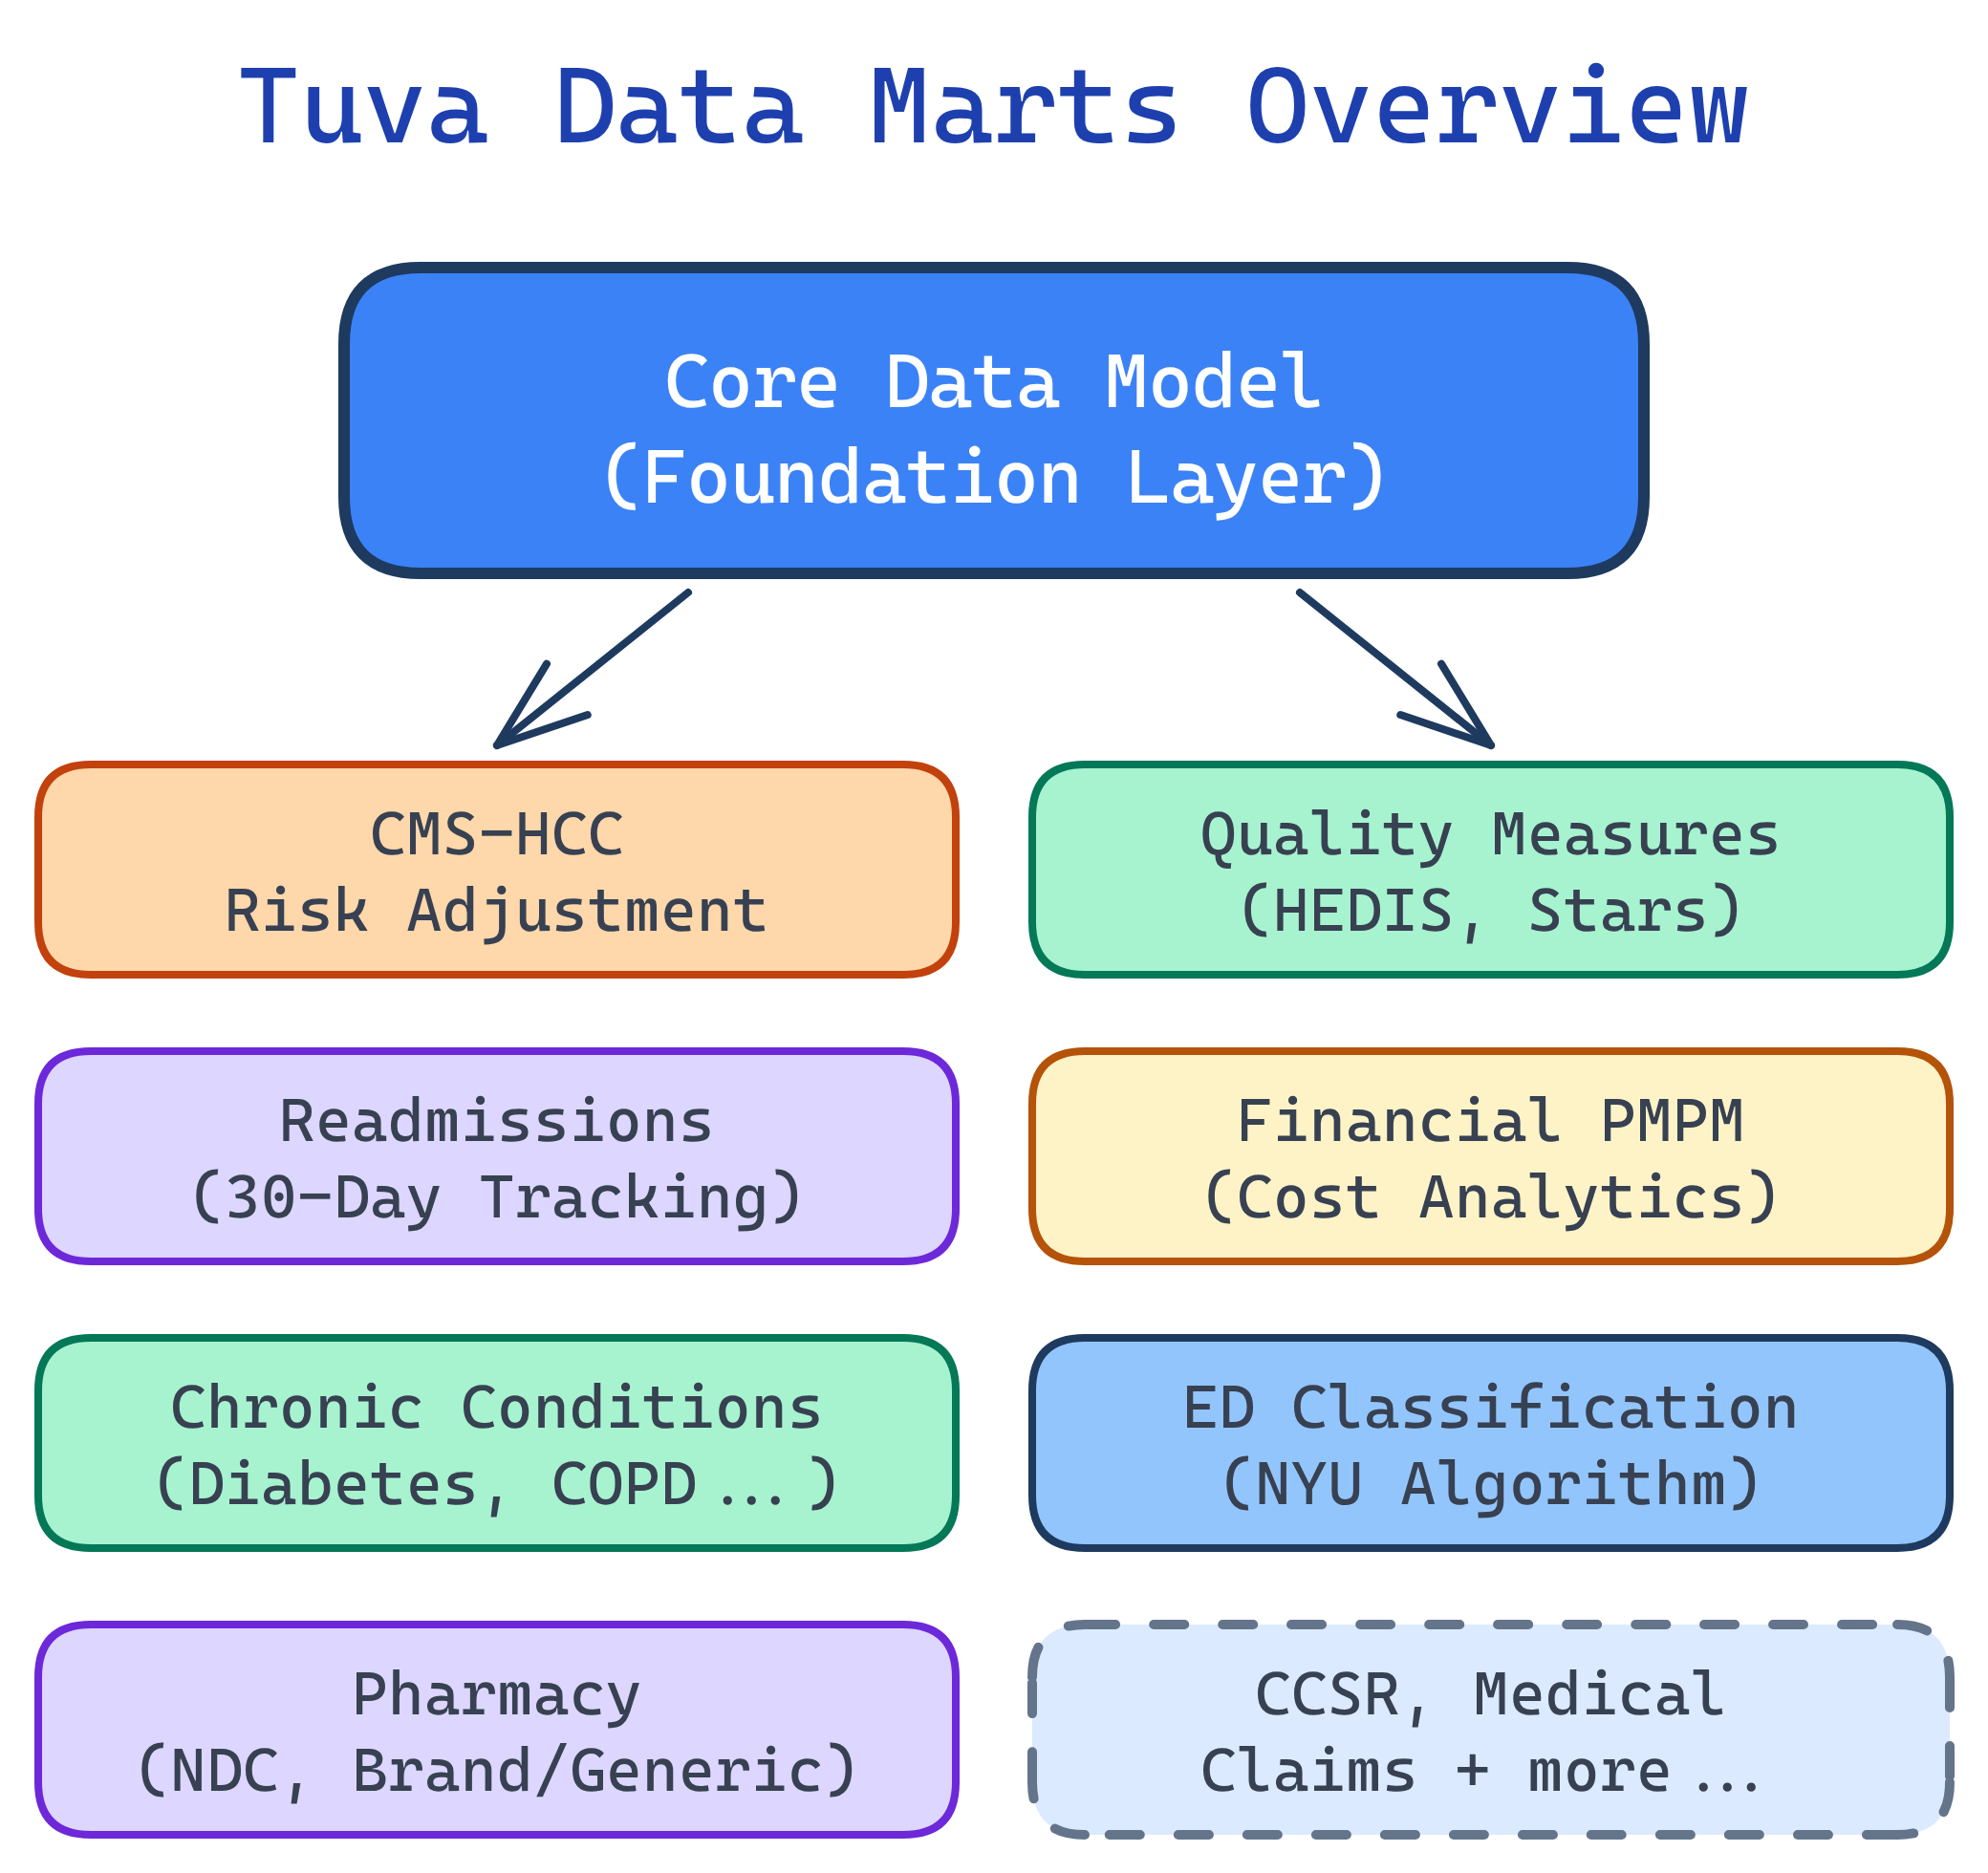
What Are Data Marts?
Data marts are pre-built analytics layers that run on top of Tuva's Core Data Model. Think of the Core Model as a clean, standardized foundation — data marts are the specialized analytics modules that sit on top and produce tables ready for BI tools like Power BI, Tableau, or Looker.
Each mart is a collection of dbt models that transform the Core Data Model into analytics-ready output tables. You enable them via dbt variables — turn on the ones you need, run dbt build, and the tables appear in your warehouse.
All 13+ Data Marts
Here's the complete landscape of Tuva's data marts. Each one solves a specific healthcare analytics problem:
| Data Mart | What It Does | Key Output Tables | Use Case |
|---|---|---|---|
| CMS-HCCs | Maps diagnoses to HCC categories, calculates RAF scores | patient_risk_factors, patient_risk_scores | Medicare Advantage risk adjustment |
| Quality Measures | Calculates HEDIS-style quality measures | summary_counts, summary_long | STAR ratings, care gap identification |
| Readmissions | Identifies 30-day all-cause readmissions | readmission_summary, encounter_augmented | CMS penalties, quality improvement |
| Financial PMPM | Per-Member-Per-Month cost analysis | pmpm_prep, pmpm_payer_plan | Healthcare financial analytics |
| Chronic Conditions | Groups patients by chronic conditions (CCW definitions) | tuva_chronic_conditions_long, tuva_chronic_conditions_wide | Population health segmentation |
| ED Classification | Classifies ED visits: emergent, non-emergent, avoidable | ed_classification_summary | Utilization management |
| CCSR | Maps ICD-10 codes to clinical categories | ccsr_dx, ccsr_pr | Clinical classification and grouping |
| HCC Suspecting | Identifies undercoded conditions | hcc_suspecting_list | Revenue recovery, coding accuracy |
| HCC Recapture | Tracks documentation gaps for known conditions | hcc_recapture_list | Annual coding completeness |
| Pharmacy | Brand/generic classification, drug analysis | pharmacy_claim_expanded | Pharmacy cost and utilization |
| Provider Attribution | Assigns members to primary care providers | provider_attribution | Value-based care, provider scorecards |
| AHRQ Measures | Agency for Healthcare Research and Quality metrics | ahrq_measures | Patient safety, prevention quality |
| FHIR Preprocessing | Transforms FHIR resources for Tuva ingestion | fhir_staging tables | FHIR-based data sources |
CMS-HCCs (Risk Adjustment)
The CMS-HCC mart maps diagnosis codes to Hierarchical Condition Categories and calculates Risk Adjustment Factor (RAF) scores. This is the engine behind Medicare Advantage risk adjustment — the process that determines how much CMS pays a plan for each member.
How It Works
- Diagnosis mapping: ICD-10 codes from claims are mapped to HCC categories using CMS's official crosswalk
- Hierarchy application: Higher-severity HCCs supersede lower ones (e.g., Diabetes with complications trumps Diabetes without complications)
- Coefficient lookup: Each HCC has a coefficient (weight) from the CMS-HCC model
- RAF calculation: Sum of demographic factors + HCC coefficients + interaction terms = RAF score
Key Output Tables
- patient_risk_factors: Every HCC mapped to each patient, with coefficients and model version
- patient_risk_scores: Final RAF score per patient, broken down by demographic and disease components
- hcc_suspecting: Conditions suggested by pharmacy or lab data but missing from claims (undercoding detection)
- hcc_recapture: Chronic conditions documented last year but not yet documented this year (documentation gap tracking)
Quality Measures (HEDIS)
The Quality Measures mart calculates HEDIS-style quality measures — the same metrics that drive CMS STAR ratings. It identifies which members are eligible for each measure (denominator), which members have met the measure (numerator), and which members have gaps in care.
What It Measures
- Breast cancer screening (BCS): Women 50–74 who received a mammogram
- Diabetes A1c control (HBD): Diabetic patients with controlled hemoglobin A1c
- Controlling blood pressure (CBP): Hypertensive patients with controlled BP
- Follow-up after hospitalization: Patients who received follow-up care within 7/30 days
Connection to STAR Ratings
Many CMS STAR rating measures come directly from HEDIS. If your HEDIS scores improve, your STAR ratings typically improve too. For Medicare Advantage plans, this means quality bonus payments worth 5% of the base benchmark — potentially hundreds of millions for large plans.
Readmissions
The Readmissions mart identifies 30-day all-cause readmissions — patients who are discharged from a hospital and readmitted within 30 days. CMS penalizes hospitals with higher-than-expected readmission rates through the Hospital Readmissions Reduction Program (HRRP).
What It Flags
- Index admissions: The original hospital stay
- Readmissions: Any subsequent admission within 30 days of discharge
- Potentially preventable readmissions: Readmissions that could have been avoided with better discharge planning or follow-up care
- Exclusions: Planned readmissions (scheduled surgeries) are excluded from penalty calculations
Financial PMPM
The Financial PMPM mart calculates Per-Member-Per-Month cost analysis — the foundational metric of healthcare financial analytics. It breaks down total spend by member, service category, provider, and time period.
The PMPM Formula
PMPM = Total Cost / Member Months
If a plan spent $10 million on 5,000 members over 12 months (60,000 member months), the PMPM is $166.67. This single number tells you the average cost to insure one member for one month.
What the Mart Produces
- Total PMPM: Combined medical + pharmacy spend per member per month
- Medical PMPM: Broken down by inpatient, outpatient, professional, ED
- Pharmacy PMPM: Brand vs. generic, specialty drug spend
- Service category breakdown: Which types of services drive the most cost
- Provider-level analysis: PMPM by provider group or facility
Chronic Conditions
The Chronic Conditions mart groups patients by chronic conditions using CMS Chronic Condition Warehouse (CCW) definitions. These are the official CMS algorithms for identifying conditions like diabetes, CHF, COPD, depression, and dozens more from claims data.
What It Enables
- Population health segmentation: Group your member population by condition for targeted interventions
- Comorbidity analysis: Identify members with multiple chronic conditions (the highest-cost, highest-risk group)
- Prevalence tracking: Monitor condition rates over time across your population
- Care management targeting: Prioritize members for disease management programs
ED Classification
The ED Classification mart classifies emergency department visits into categories: emergent, non-emergent, and avoidable. Non-emergent ED visits represent a massive cost opportunity — these patients could have been treated in a primary care setting at a fraction of the cost.
This mart is essential for utilization management teams who track ED usage patterns and design programs to redirect non-emergent visits to urgent care or telehealth.
CCSR (Clinical Classifications)
The CCSR mart maps ICD-10 codes to clinically meaningful categories using AHRQ's Clinical Classifications Software Refined system. Instead of working with 70,000+ individual ICD-10 codes, you can analyze data at the level of ~530 diagnosis categories and ~320 procedure categories.
CCSR replaces the older CCS (Clinical Classifications Software) system and is now the standard for clinical grouping in healthcare analytics.
Other Marts
Tuva includes several additional marts for specialized use cases:
- AHRQ Measures: Patient safety indicators (PSIs) and prevention quality indicators (PQIs) from the Agency for Healthcare Research and Quality
- Pharmacy: Expands pharmacy claims with brand/generic classification, therapeutic class, and drug-level analytics
- Provider Attribution: Assigns each member to their primary care provider using claims-based attribution logic
- FHIR Preprocessing: Transforms raw FHIR resources (Patient, Condition, MedicationRequest, etc.) into Tuva's Input Layer format for ingestion
- HCC Recapture: Tracks chronic conditions documented in prior years but not yet documented in the current year — these are documentation gaps that need provider attention
- HCC Suspecting: Identifies conditions suggested by pharmacy data (e.g., insulin prescriptions without a diabetes diagnosis) or lab results that haven't been coded on claims
Enabling Data Marts
Data marts are controlled via dbt variables in your dbt_project.yml. You can enable all marts at once or pick individual ones:
Enable All Marts
# dbt_project.yml
vars:
  tuva_marts_enabled: true
Enable Individual Marts
# dbt_project.yml
vars:
  cms_hcc_enabled: true
  quality_measures_enabled: true
  readmissions_enabled: true
  financial_pmpm_enabled: true
  chronic_conditions_enabled: true
  ed_classification_enabled: true
Then run dbt build and the enabled marts will materialize their output tables in your data warehouse.
Connecting to BI Tools
Once the data marts run, their output tables live in your data warehouse (Snowflake, BigQuery, Redshift, Databricks, or DuckDB). Connecting to BI tools is straightforward — just point your tool at the mart tables.
Common Report Patterns
- Executive PMPM dashboard: Connect to the Financial PMPM mart. Show total/medical/pharmacy PMPM trends by month, service category breakdown, and top cost drivers.
- Risk adjustment scorecard: Connect to the CMS-HCC mart. Show RAF score distributions, HCC capture rates, suspecting opportunities, and recapture gaps.
- Quality measures tracker: Connect to the Quality Measures mart. Show numerator/denominator rates per measure, gap counts, and distance to STAR thresholds.
- Population health view: Connect to the Chronic Conditions mart. Show condition prevalence, comorbidity patterns, and high-risk member lists.
- Readmission monitor: Connect to the Readmissions mart. Show 30-day readmission rates, trends, and contributing factors.
Test Yourself
Q: What are Tuva data marts, and how do they relate to the Core Data Model?
dbt build.Q: How does the CMS-HCC data mart calculate RAF scores?
Q: What is PMPM and why is it the most important metric in healthcare finance?
Q: What is the difference between HCC suspecting and HCC recapture?
Q: How do you enable specific data marts in Tuva?
dbt_project.yml. You can enable all marts at once with tuva_marts_enabled: true, or enable individual marts with specific variables like cms_hcc_enabled: true, quality_measures_enabled: true, readmissions_enabled: true, etc. Then run dbt build and the enabled marts materialize their output tables in your data warehouse.Interview Questions
Q: What is the CMS-HCC data mart used for?
Q: How does Tuva calculate PMPM?
Q: What is the difference between HCC suspecting and HCC recapture?
Q: How would you use Tuva's readmissions mart for quality improvement?