Healthcare Analytics & Reports
Healthcare analytics spans claims analytics, clinical analytics, population health, risk adjustment, and quality measures (HEDIS, STAR ratings). Key reports include HEDIS scores, CMS STAR ratings, and risk adjustment outputs. If you're a data professional in healthcare, these are your bread and butter.
Explain Like I'm 12
Think of HEDIS and STAR ratings like report cards for insurance companies. Just like your school gives you grades on math, reading, and science, the government gives insurance companies grades on things like "Did your patients get their flu shots?" and "Did sick people get follow-up care?"
If an insurance company gets good grades (4 or 5 stars), they get bonus money from the government. If they get bad grades, they might lose customers. So everyone works really hard to get good scores — and data analysts are the people who track all those grades.
The Healthcare Analytics Landscape
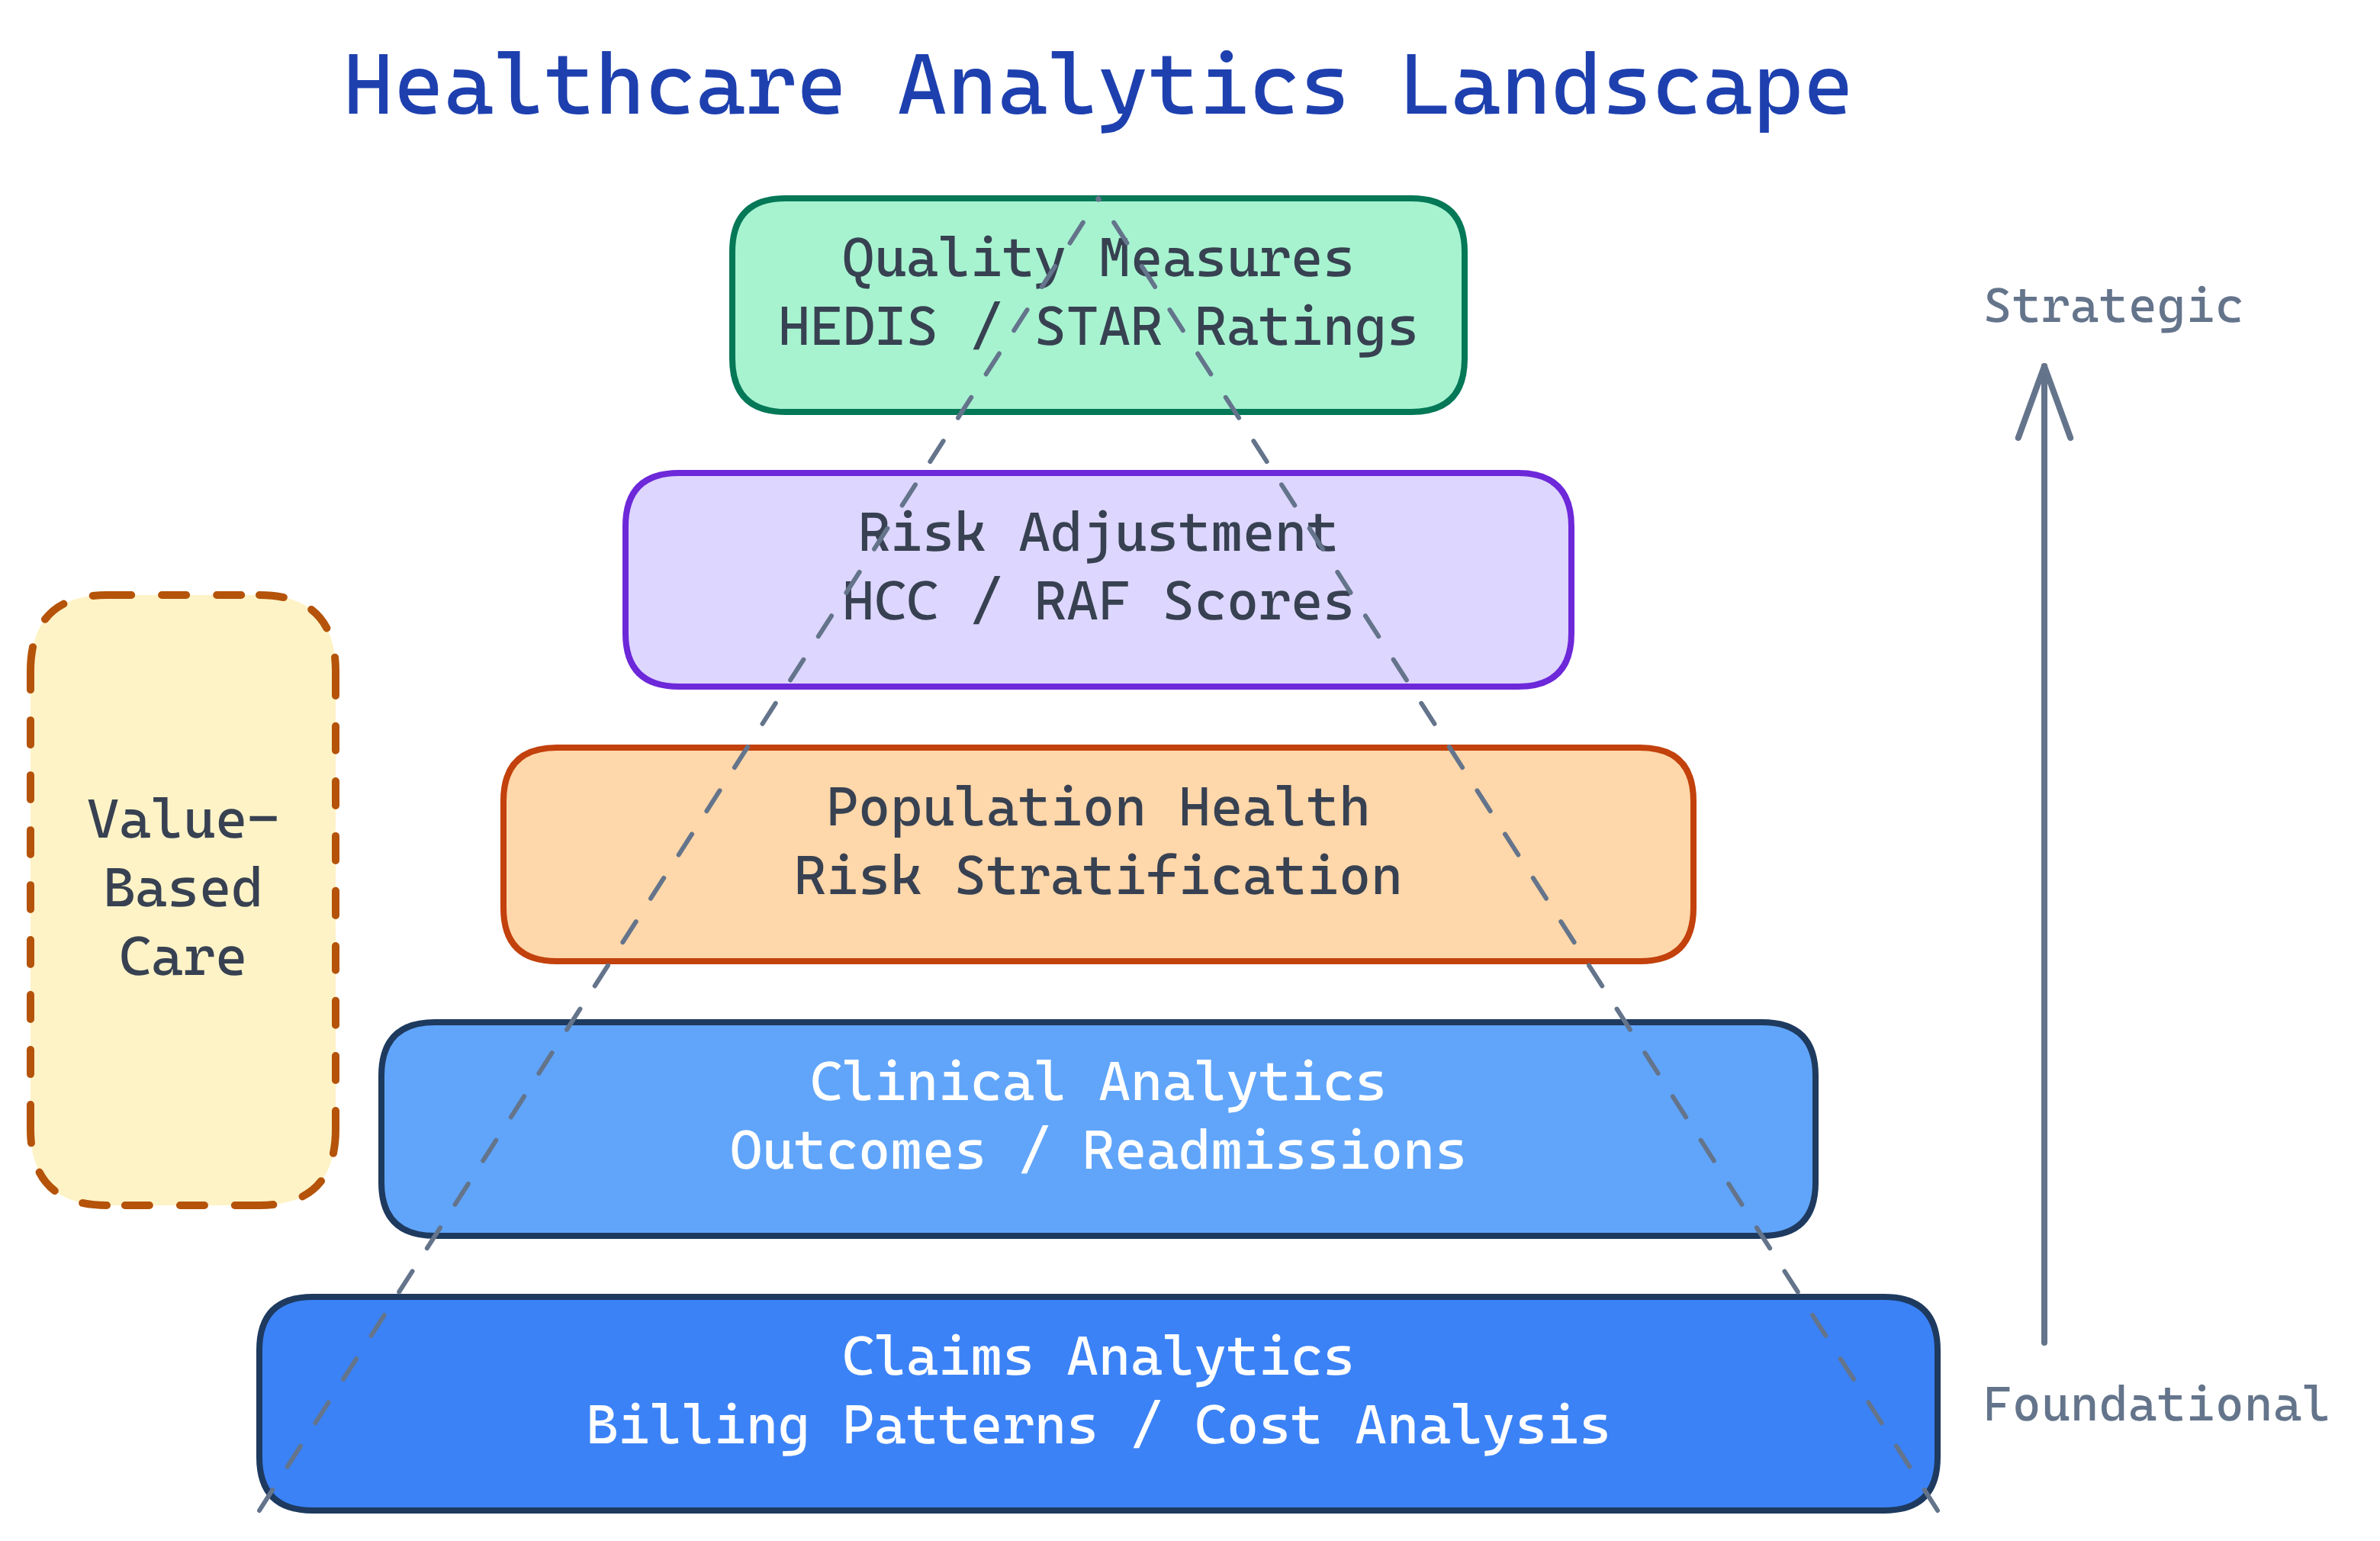
Types of Healthcare Analytics
Healthcare analytics isn't one thing — it's at least five distinct domains, each with its own data sources, methods, and stakeholders. Here's the landscape:
| Analytics Type | What It Analyzes | Key Data Sources | Who Uses It |
|---|---|---|---|
| Claims Analytics | Billing patterns, cost drivers, fraud detection, utilization | 837/835 claims, enrollment files | Payers, TPAs, finance teams |
| Clinical Analytics | Patient outcomes, readmissions, patient safety, treatment effectiveness | EHR data, lab results, clinical notes | Providers, quality teams, CMOs |
| Population Health | Risk stratification, chronic disease management, preventive care gaps | Claims + clinical + SDOH data | ACOs, health plans, public health |
| Risk Adjustment | HCC codes, RAF scores, predicted future costs | Diagnosis codes from claims & encounters | Medicare Advantage plans, coding teams |
| Predictive Analytics | Readmission risk, no-show prediction, disease progression | All of the above + ML models | Care management, operations |
HEDIS — The Industry Standard
HEDIS (Healthcare Effectiveness Data and Information Set) is the most widely used quality measurement system in US healthcare. It's maintained by NCQA (National Committee for Quality Assurance) and used by 90% of US health plans.
What HEDIS Measures
HEDIS includes 90+ measures across 6 domains:
| Domain | What It Covers | Example Measures |
|---|---|---|
| Effectiveness of Care | Are patients getting the right treatments? | Breast cancer screening (BCS), A1c control for diabetes (HBD), controlling blood pressure (CBP) |
| Access/Availability | Can patients get care when they need it? | Adults' access to preventive care (AAP), prenatal & postpartum care (PPC) |
| Experience of Care | How do patients rate their care? | CAHPS survey results (patient satisfaction) |
| Utilization | How are services being used? | Frequency of selected procedures, antibiotic utilization |
| Health Plan Descriptive | Who is in the plan? | Board certification, enrollment data |
| Electronic Clinical Data | EHR-sourced quality data | ECDS-based measures using clinical data instead of claims |
The HEDIS Cycle
HEDIS runs on an annual cycle. Understanding this cycle is essential for anyone building HEDIS reports:
- Measurement Year (MY): The calendar year being measured (e.g., January 1 – December 31, 2025)
- Data Collection: Plans pull claims, encounter, and clinical data for the measurement year
- Audit: NCQA-certified auditors review the data and methodology
- Reporting: Plans submit rates to NCQA
- Public Release: Scores are published for plan comparison and STAR rating calculation
CMS STAR Ratings
CMS assigns every Medicare Advantage and Part D plan a 1-to-5 star rating each year. This isn't just a vanity metric — it directly impacts revenue.
The 5 STAR Categories
| Category | What It Measures | Example Metrics |
|---|---|---|
| Outcomes | Did patients actually get healthier? | Controlling blood pressure, diabetes control |
| Patient Experience | How do members rate their care? | CAHPS survey scores, complaints |
| Access | Can members reach doctors and services? | Call center hold times, network adequacy |
| Process | Are recommended screenings happening? | Breast cancer screening, flu vaccination rates |
| Complaints & Appeals | Are members dissatisfied? | Grievance rates, CTM complaints, appeals outcomes |
Why STAR Ratings = Money
Here's why health plans obsess over STAR ratings:
- 4+ stars = quality bonus payments from CMS (typically 5% of the base benchmark)
- For a large plan, this can mean hundreds of millions of dollars in additional revenue
- Plans with high STAR ratings can use the "STAR" designation in marketing during Open Enrollment
- Plans below 3 stars for 3 consecutive years can be terminated by CMS
2026 STAR Changes
CMS is making significant changes to the STAR rating methodology:
- SDOH factors: Social determinants of health will be incorporated into adjustment models
- Health equity reward: Plans that reduce disparities across racial, ethnic, and socioeconomic groups can earn bonus points
- Measure weight changes: Patient experience and outcomes measures will carry more weight
Risk Adjustment
Risk adjustment is one of the most important (and highest-stakes) analytics areas in healthcare. The core idea is simple: sicker patients cost more, so plans that enroll sicker patients should get paid more.
How HCC / RAF Works
| Concept | What It Is | Example |
|---|---|---|
| HCC | Hierarchical Condition Category — groups of diagnosis codes that predict future costs | HCC 19 = Diabetes without complication (ICD-10: E11.9) |
| RAF Score | Risk Adjustment Factor — a multiplier applied to per-member payments | RAF 1.2 = patient is predicted to cost 20% more than average |
| CMS-HCC Model | The algorithm CMS uses to calculate RAF from diagnoses | Takes age, sex, Medicaid status, and HCCs as inputs |
The Money Flow
CMS pays Medicare Advantage plans a per-member-per-month (PMPM) rate. That rate is adjusted by the RAF score:
Payment = Base rate × RAF score
A patient with a RAF of 1.0 is "average." A patient with a RAF of 2.5 is expected to cost 2.5x the average — and the plan gets paid 2.5x more for that patient. This is why coding accuracy is so critical.
Value-Based Care Analytics
The entire US healthcare system is slowly shifting from fee-for-service (pay for every service) to value-based care (pay for outcomes). This shift fundamentally changes what analytics teams measure.
Fee-for-Service vs. Value-Based
| Aspect | Fee-for-Service | Value-Based Care |
|---|---|---|
| Payment model | Pay per procedure/visit | Pay for outcomes, shared savings, bundled payments |
| Incentive | Do more (volume) | Do better (quality) |
| Key metrics | Claim counts, revenue per procedure | Readmission rates, patient satisfaction, cost per episode |
| Risk | Payer bears most risk | Risk shared between payer and provider |
Key Value-Based Models
- ACOs (Accountable Care Organizations): Groups of providers who share responsibility (and savings/losses) for a patient population. Medicare's MSSP program is the largest.
- Bundled Payments: One fixed payment for an entire episode of care (e.g., hip replacement surgery + rehab + follow-up). If the provider spends less than the bundle, they keep the difference.
- Capitation: A fixed per-member-per-month payment regardless of services used. The provider manages all care within that budget.
- Pay-for-Performance: Bonus payments tied to hitting quality metrics (often HEDIS/STAR measures).
Key Reports for Data Professionals
If you're building dashboards or reports in healthcare, these are the ones you'll encounter most often:
| Report | Who Uses It | Frequency | Primary Data Source | Why It Matters |
|---|---|---|---|---|
| HEDIS Measure Rates | Quality teams, NCQA | Annual (with monthly tracking) | Claims + clinical data | Drives STAR ratings and accreditation |
| STAR Rating Submission | Medicare Advantage plans, CMS | Annual | HEDIS, CAHPS, HOS, complaints | Determines quality bonus payments |
| Risk Adjustment Submission | MA plans, CMS | Annual (with sweeps) | Diagnosis codes from encounters | Directly impacts plan revenue |
| Utilization Management | Medical directors, UM teams | Monthly | Claims, authorizations | Controls costs, identifies overuse |
| Cost & Trend Reports | Finance, actuaries, CFO | Monthly / Quarterly | Claims, enrollment | Tracks medical cost trends for pricing |
| Provider Scorecard | Provider relations, network team | Quarterly | Claims, quality data | Evaluates provider performance for contracts |
| Fraud, Waste & Abuse | SIU, compliance | Ongoing | Claims patterns, outlier analysis | Identifies billing anomalies and potential fraud |
Test Yourself
Q: What are the 5 main types of healthcare analytics?
Q: What is HEDIS, and why does it matter?
Q: How does a plan's STAR rating affect its revenue?
Q: What is a RAF score, and why does coding accuracy matter?
Q: What's the difference between fee-for-service and value-based care?
Interview Questions
Q: Explain what HEDIS measures are and give examples of how they're used in analytics.
Q: How do STAR ratings impact a Medicare Advantage plan's business?
Q: What is risk adjustment in Medicare Advantage, and why is it important for data professionals?
Q: Describe a use case for claims analytics in a healthcare payer organization.