Data Science Core Concepts
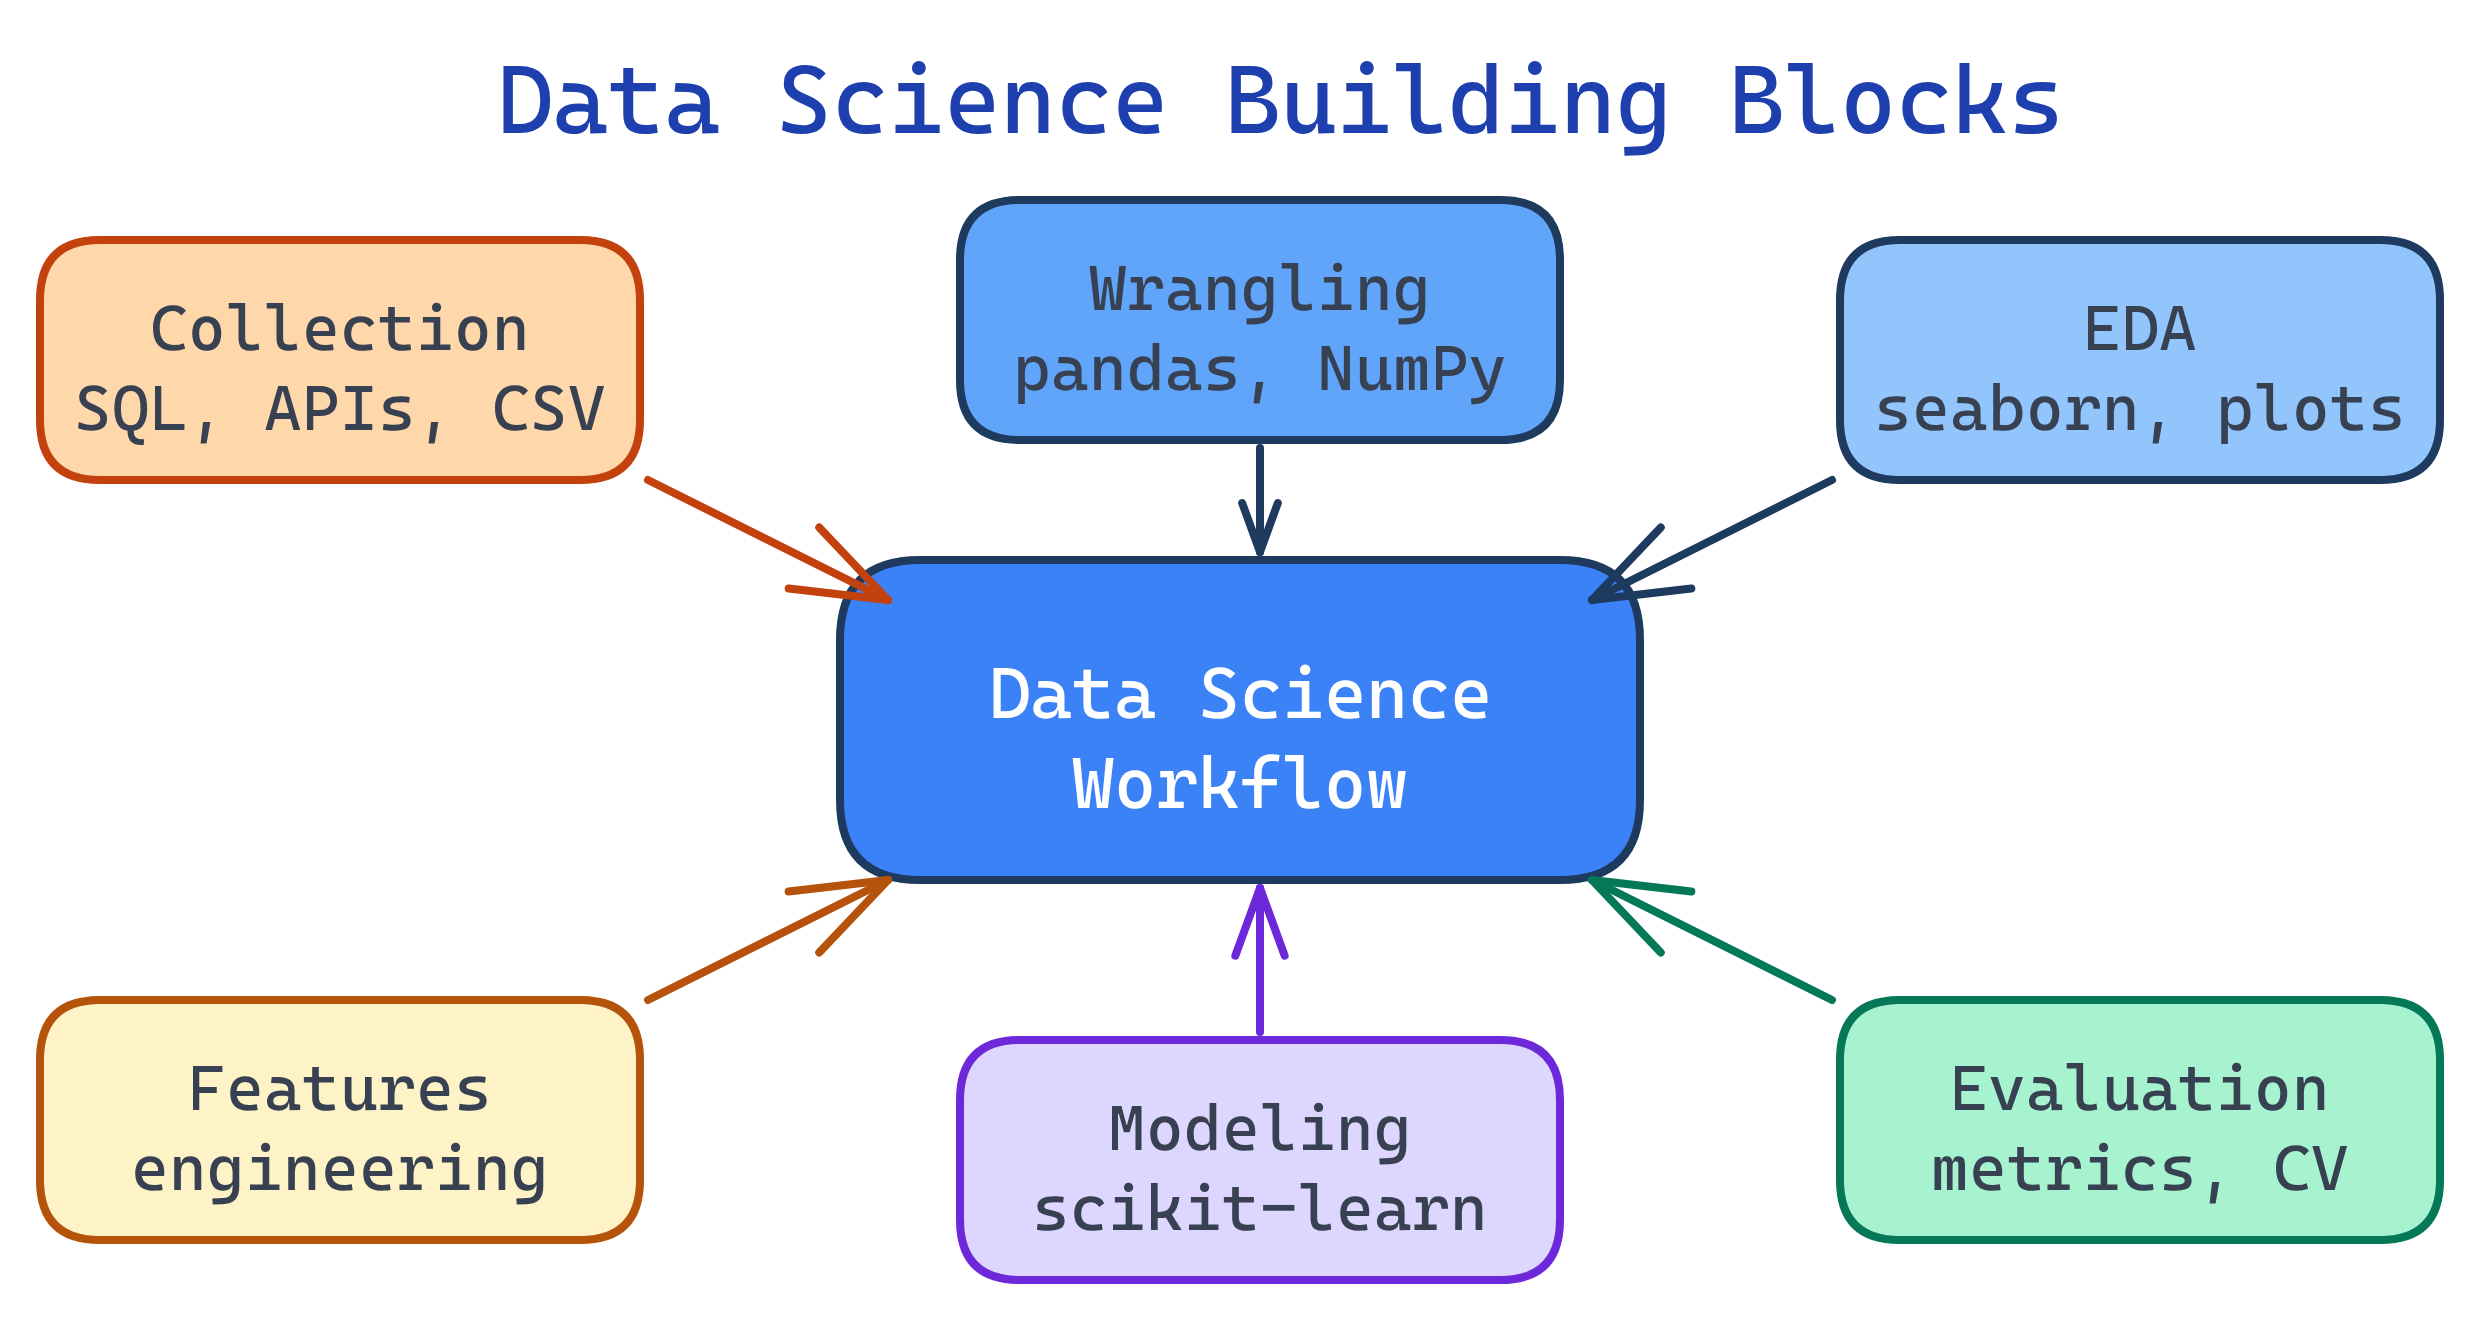
Data science has 6 building blocks: data collection, data wrangling, exploratory data analysis (EDA), feature engineering, modeling, and evaluation. Master these and you can tackle any data science project from start to finish.
Concept Map
These six building blocks form a pipeline. Each step feeds into the next, and you'll often loop back to earlier steps as you learn more about the data.
Explain Like I'm 12
Think of data science like cooking a meal. Data collection is going to the grocery store. Data wrangling is washing and chopping the ingredients. EDA is tasting as you go to understand flavors. Feature engineering is adding the right spices. Modeling is actually cooking the dish (combining everything). Evaluation is having someone taste it and tell you if it's good. If it's not great, you go back and adjust!
Cheat Sheet
| Concept | What It Does | Key Tools |
|---|---|---|
| Data Collection | Gather raw data from APIs, databases, files, web scraping | SQL, requests, BeautifulSoup, APIs |
| Data Wrangling | Clean missing values, fix types, remove duplicates, handle outliers | pandas, NumPy |
| EDA | Explore distributions, correlations, patterns visually and statistically | matplotlib, seaborn, pandas .describe() |
| Feature Engineering | Create new columns that help models learn better | pandas, scikit-learn transformers |
| Modeling | Train algorithms to find patterns and make predictions | scikit-learn, XGBoost, TensorFlow |
| Evaluation | Measure model performance with metrics, avoid overfitting | accuracy, precision, recall, RMSE, cross-validation |
The Building Blocks
1. Data Collection
Every project starts with getting the data. This could mean querying a SQL database, calling a REST API, reading CSV files, or scraping web pages. The key question: Is your data representative of the problem you're solving?
import pandas as pd

# From CSV
df = pd.read_csv('sales_data.csv')

# From SQL database
import sqlalchemy
engine = sqlalchemy.create_engine('postgresql://user:pass@host/db')
df = pd.read_sql('SELECT * FROM sales WHERE year = 2025', engine)

# From API
import requests
response = requests.get('https://api.example.com/data')
df = pd.DataFrame(response.json()['results'])2. Data Wrangling (Cleaning)
Real-world data is messy. Expect missing values, wrong data types, duplicates, and outliers. Data scientists spend 60-80% of their time on this step. The goal is a clean, consistent dataset ready for analysis.
import pandas as pd
import numpy as np

# Check for issues
print(df.info())          # data types & non-null counts
print(df.isnull().sum())  # missing values per column

# Handle missing values
df['age'].fillna(df['age'].median(), inplace=True)
df.dropna(subset=['target'], inplace=True)  # drop rows without target

# Fix data types
df['date'] = pd.to_datetime(df['date'])
df['category'] = df['category'].astype('category')

# Remove duplicates
df.drop_duplicates(inplace=True)df.info() and df.describe() first. They reveal 80% of data quality issues in seconds.3. Exploratory Data Analysis (EDA)
EDA is about asking questions and looking for answers in the data before building any model. You use statistics and visualizations to understand distributions, spot outliers, find correlations, and generate hypotheses.
import matplotlib.pyplot as plt
import seaborn as sns

# Distribution of a numeric column
df['price'].hist(bins=50)
plt.title('Price Distribution')
plt.show()

# Correlation heatmap
corr = df.select_dtypes(include='number').corr()
sns.heatmap(corr, annot=True, cmap='coolwarm')
plt.title('Feature Correlations')
plt.show()

# Group statistics
df.groupby('category')['revenue'].agg(['mean', 'median', 'std'])4. Feature Engineering
This is where domain knowledge meets programming. Feature engineering means creating new columns (features) from existing data that help the model learn better. It's often the biggest factor in model performance.
# Extract date components
df['day_of_week'] = df['date'].dt.dayofweek
df['month'] = df['date'].dt.month
df['is_weekend'] = df['day_of_week'].isin([5, 6]).astype(int)

# Bin continuous variables
df['age_group'] = pd.cut(df['age'], bins=[0, 18, 35, 50, 65, 100],
                          labels=['teen', 'young', 'mid', 'senior', 'elderly'])

# Encode categorical variables
df = pd.get_dummies(df, columns=['category'], drop_first=True)

# Interaction features
df['price_per_sqft'] = df['price'] / df['sqft']5. Modeling
Now you train an algorithm on your prepared data. The model learns patterns from training data and tries to generalize to unseen test data. Always split your data before training!
from sklearn.model_selection import train_test_split
from sklearn.ensemble import RandomForestClassifier

# Split: 80% train, 20% test
X = df.drop('target', axis=1)
y = df['target']
X_train, X_test, y_train, y_test = train_test_split(
    X, y, test_size=0.2, random_state=42
)

# Train
model = RandomForestClassifier(n_estimators=100, random_state=42)
model.fit(X_train, y_train)

# Predict
y_pred = model.predict(X_test)6. Evaluation
How do you know if your model is actually good? Use the right metric for your problem type and validate with cross-validation to ensure your results are stable.
from sklearn.metrics import (accuracy_score, precision_score,
                               recall_score, f1_score,
                               confusion_matrix, classification_report)
from sklearn.model_selection import cross_val_score

# Basic metrics
print(f"Accuracy:  {accuracy_score(y_test, y_pred):.3f}")
print(f"Precision: {precision_score(y_test, y_pred):.3f}")
print(f"Recall:    {recall_score(y_test, y_pred):.3f}")
print(f"F1 Score:  {f1_score(y_test, y_pred):.3f}")

# Full classification report
print(classification_report(y_test, y_pred))

# Cross-validation (more reliable)
cv_scores = cross_val_score(model, X, y, cv=5, scoring='f1')
print(f"CV F1: {cv_scores.mean():.3f} +/- {cv_scores.std():.3f}")| Problem Type | Key Metrics | When to Use |
|---|---|---|
| Classification | Accuracy, Precision, Recall, F1, AUC-ROC | Predicting categories (spam/not spam) |
| Regression | MAE, MSE, RMSE, R² | Predicting numbers (house price) |
| Clustering | Silhouette score, Inertia | Grouping similar items |
Test Yourself
You have a dataset with 20% missing values in the "income" column. What are two strategies to handle this?
Why is cross-validation better than a single train/test split?
When would you choose Recall over Precision as your primary metric?
What is feature engineering and why does it matter?
Why should you never evaluate a model on training data?