PostgreSQL Database Optimization
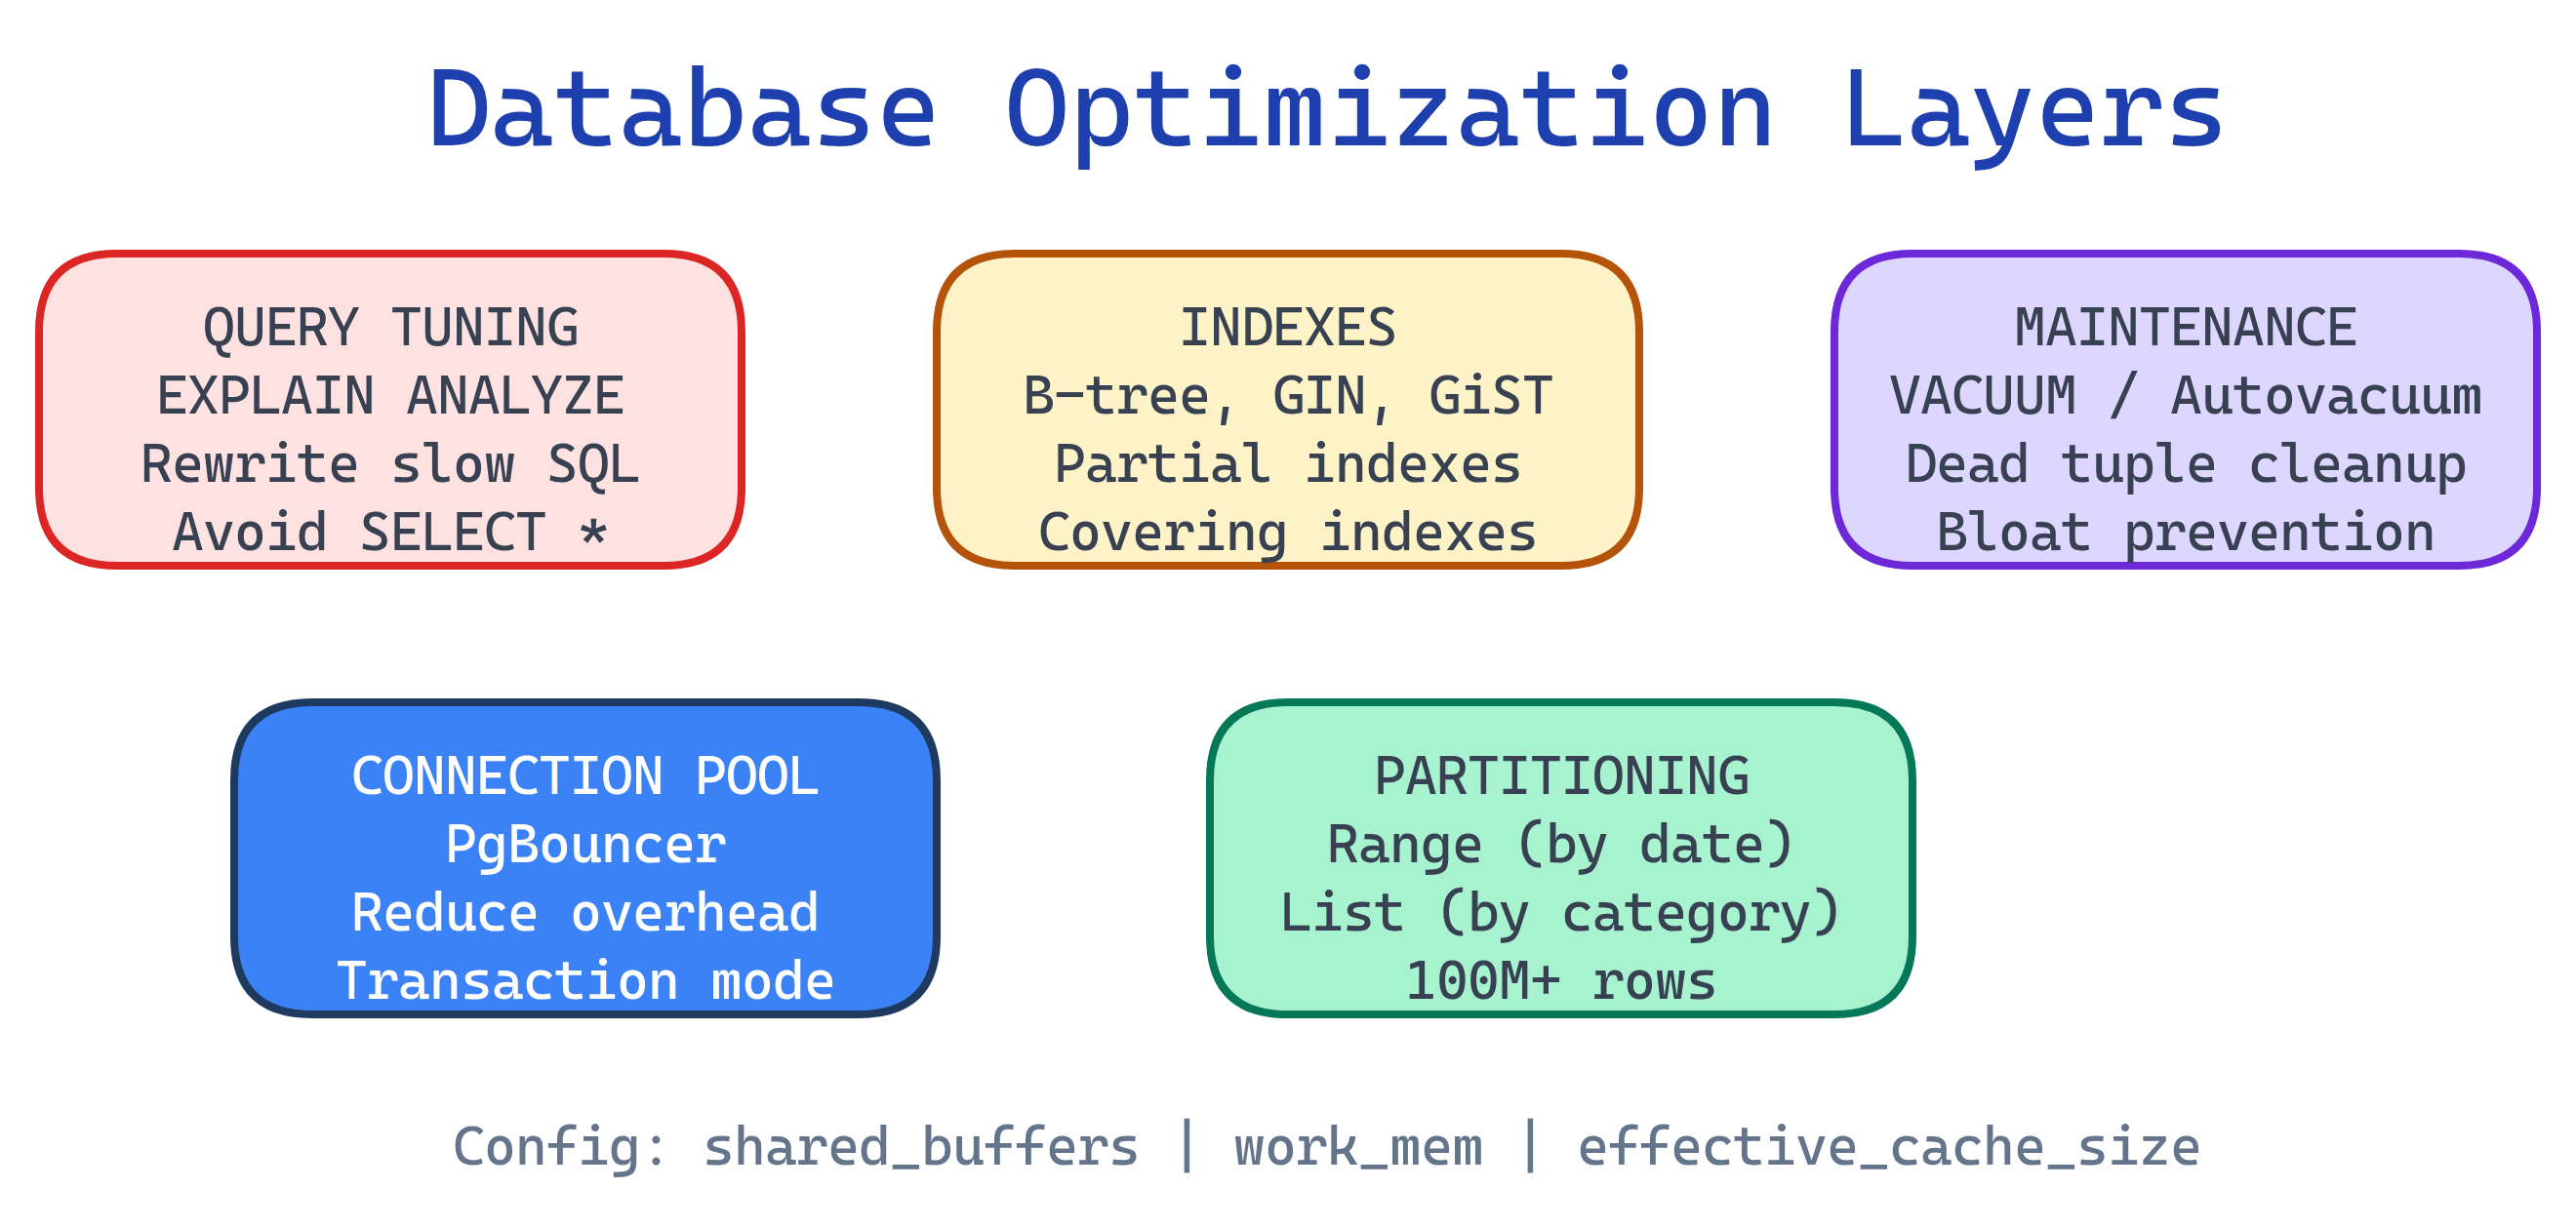
Database optimization in PostgreSQL spans multiple layers: indexes (B-tree, GIN, GiST, BRIN) speed up reads, EXPLAIN ANALYZE reveals how queries actually execute, query tuning eliminates common anti-patterns, VACUUM and autovacuum reclaim dead space from MVCC, connection pooling (PgBouncer) handles high concurrency, table partitioning manages massive tables, and configuration tuning (shared_buffers, work_mem, etc.) tailors Postgres to your hardware.
Explain Like I'm 12
Imagine a huge library with millions of books. Without any system, finding one book means checking every shelf (that's a sequential scan). Adding a card catalog is like creating an index — now you jump straight to the right shelf.
EXPLAIN ANALYZE is like a stopwatch that shows exactly how the librarian searched — which shelves they checked and how long each step took. VACUUM is the janitor who clears out returned books sitting on carts so there's room for new ones. Connection pooling is like a waiting line — instead of 500 people rushing into the library at once, a bouncer lets in 20 at a time. And partitioning is like splitting History into its own wing so you don't search through Science to find it.
Optimization Layers
EXPLAIN ANALYZE
EXPLAIN ANALYZE is the single most important optimization tool in PostgreSQL. It runs the query and shows the actual execution plan with real timing data.
Reading a Query Plan
EXPLAIN ANALYZE
SELECT u.name, o.total
FROM users u
JOIN orders o ON o.user_id = u.id
WHERE o.created_at >= '2025-01-01'
  AND o.total > 100
ORDER BY o.total DESC
LIMIT 20;
-- Example output (simplified):
Limit (cost=1234.56..1234.61 rows=20 width=52) (actual time=2.341..2.358 rows=20 loops=1)
-> Sort (cost=1234.56..1245.12 rows=4225 width=52) (actual time=2.339..2.348 rows=20 loops=1)
Sort Key: o.total DESC
Sort Method: top-N heapsort Memory: 27kB
-> Hash Join (cost=45.00..1123.45 rows=4225 width=52) (actual time=0.312..1.895 rows=4201 loops=1)
Hash Cond: (o.user_id = u.id)
-> Index Scan using idx_orders_created_at on orders o (cost=0.42..1050.00 rows=4225 width=20) (actual time=0.025..1.234 rows=4201 loops=1)
Index Cond: (created_at >= '2025-01-01')
Filter: (total > 100)
Rows Removed by Filter: 812
-> Hash (cost=30.00..30.00 rows=1200 width=36) (actual time=0.270..0.271 rows=1200 loops=1)
Buckets: 2048 Batches: 1 Memory Usage: 75kB
-> Seq Scan on users u (cost=0.00..30.00 rows=1200 width=36) (actual time=0.005..0.112 rows=1200 loops=1)
Planning Time: 0.185 ms
Execution Time: 2.412 ms- cost — estimated startup..total cost (arbitrary units, not milliseconds)
- actual time — real wall-clock time in milliseconds
- rows — estimated vs. actual row count (big mismatches = stale statistics)
- loops — how many times this node executed (multiply time by loops for true cost)
- Buffers — add
BUFFERSoption to see shared/local hit/read counts
Scan Types
| Scan Type | What It Means | When It's Used |
|---|---|---|
| Seq Scan | Full table scan, reads every row | No useful index, or table is small |
| Index Scan | Looks up index, then fetches rows from table | Selective query with matching index |
| Index Only Scan | Answers query from index alone (no table visit) | All needed columns are in the index (covering index) |
| Bitmap Index Scan | Builds a bitmap of matching pages, then reads them | Moderate selectivity, or combining multiple indexes |
EXPLAIN (ANALYZE, BUFFERS, FORMAT TEXT) for the most useful output. Add VERBOSE when you need to see which columns are being projected. Remember: ANALYZE actually runs the query, so be careful with INSERT/UPDATE/DELETE — wrap in a transaction and ROLLBACK.-- Safe way to EXPLAIN a destructive query
BEGIN;
EXPLAIN (ANALYZE, BUFFERS)
DELETE FROM old_logs WHERE created_at < '2024-01-01';
ROLLBACK;Index Types & Strategy
Choosing the right index type is the highest-ROI optimization you can make. Each type is built for specific query patterns.
B-tree (Default)
The workhorse index. Supports equality (=) and range (<, >, BETWEEN, ORDER BY).
-- Automatically created for PRIMARY KEY and UNIQUE constraints
-- Manually create for frequently filtered columns
CREATE INDEX idx_orders_created_at ON orders (created_at);

-- Composite index: left-to-right column order matters
CREATE INDEX idx_orders_user_date ON orders (user_id, created_at DESC);(user_id, created_at) supports WHERE user_id = 5 AND created_at > '2025-01-01' perfectly. Reversed order would not use the index for the date filter efficiently.Hash Index
Optimized for equality-only lookups. Smaller than B-tree for long text keys. Crash-safe since PostgreSQL 10.
-- Good for exact match on long strings (e.g., URLs, session tokens)
CREATE INDEX idx_sessions_token ON sessions USING hash (token);
GIN (Generalized Inverted Index)
Built for values that contain multiple elements: full-text search, JSONB, and arrays.
-- Full-text search
CREATE INDEX idx_articles_fts ON articles USING gin (to_tsvector('english', title || ' ' || body));

-- JSONB containment queries
CREATE INDEX idx_events_data ON events USING gin (metadata jsonb_path_ops);

-- Array contains
CREATE INDEX idx_posts_tags ON posts USING gin (tags);
GiST (Generalized Search Tree)
For geometric data, range types, and full-text search (when you need ranking with ts_rank).
-- Geographic queries (PostGIS)
CREATE INDEX idx_locations_geom ON locations USING gist (geom);

-- Range type overlap
CREATE INDEX idx_bookings_period ON bookings USING gist (date_range);
BRIN (Block Range Index)
Extremely compact index for large, naturally ordered tables (e.g., time-series). Stores min/max per block range.
-- Perfect for append-only log tables ordered by timestamp
CREATE INDEX idx_logs_created ON logs USING brin (created_at);

-- Tiny index: a BRIN on 1 billion rows might be only a few MB
-- vs. a B-tree that could be several GBCLUSTER or append-only patterns.Partial Indexes
Index only the rows you actually query. Smaller, faster, less write overhead.
-- Only index active orders (skip the 90% that are completed)
CREATE INDEX idx_orders_active ON orders (created_at)
WHERE status = 'active';

-- Only index non-null emails
CREATE INDEX idx_users_email ON users (email)
WHERE email IS NOT NULL;
Covering Indexes (INCLUDE)
Add non-key columns to the index so queries can be answered without visiting the table (Index Only Scan).
-- The query needs user_id (filter) + name, email (select)
-- INCLUDE adds name and email to the index leaf pages
CREATE INDEX idx_users_id_covering ON users (id)
INCLUDE (name, email);
Expression Indexes
Index the result of a function or expression, not just a raw column.
-- Case-insensitive email lookup
CREATE INDEX idx_users_email_lower ON users (LOWER(email));

-- Extract year for date queries
CREATE INDEX idx_orders_year ON orders (EXTRACT(YEAR FROM created_at));
When NOT to Index
- Slows down every INSERT, UPDATE, and DELETE (the index must be updated too)
- Consumes disk space and RAM (indexes compete for
shared_buffers) - May not be used if the planner estimates a Seq Scan is cheaper (small tables, low selectivity)
Rule of thumb: If a column has low cardinality (e.g., a boolean or status with 3 values), a B-tree index usually won't help. Check pg_stat_user_indexes for unused indexes and drop them.
Query Optimization Patterns
These patterns address the most common performance mistakes in PostgreSQL queries.
Avoid SELECT *
-- Bad: fetches all 30 columns, prevents Index Only Scans
SELECT * FROM orders WHERE user_id = 42;

-- Good: only fetch what you need
SELECT id, total, status, created_at
FROM orders WHERE user_id = 42;SELECT * also breaks when columns are added or renamed. Explicit column lists make queries more maintainable and more cache-friendly.Use EXISTS Instead of IN for Subqueries
-- Slower: IN materializes the entire subquery result
SELECT * FROM users
WHERE id IN (SELECT user_id FROM orders WHERE total > 1000);

-- Faster: EXISTS short-circuits as soon as a match is found
SELECT * FROM users u
WHERE EXISTS (
  SELECT 1 FROM orders o
  WHERE o.user_id = u.id AND o.total > 1000
);
Prefer JOINs Over Correlated Subqueries
-- Slow: subquery runs once per row in users
SELECT u.name,
  (SELECT COUNT(*) FROM orders o WHERE o.user_id = u.id) AS order_count
FROM users u;

-- Fast: single join with aggregate
SELECT u.name, COUNT(o.id) AS order_count
FROM users u
LEFT JOIN orders o ON o.user_id = u.id
GROUP BY u.name;
Top-N with LIMIT + ORDER BY
-- If there's an index on (created_at DESC), Postgres can
-- stop after finding 10 rows instead of sorting everything
SELECT id, total, created_at
FROM orders
ORDER BY created_at DESC
LIMIT 10;
Batch INSERTs
-- Bad: 1000 round trips, 1000 transaction commits
INSERT INTO logs (message) VALUES ('event 1');
INSERT INTO logs (message) VALUES ('event 2');
-- ... 998 more

-- Good: single statement, single transaction
INSERT INTO logs (message) VALUES
  ('event 1'),
  ('event 2'),
  ('event 3');
-- ... up to 1000+ rows in one statement

-- Best for large loads: COPY (binary protocol, fastest)
COPY logs (message) FROM '/tmp/events.csv' WITH (FORMAT csv);COPY is 5-10x faster than multi-row INSERT for bulk loading. It bypasses the SQL parser and uses a binary protocol. Use \copy in psql for client-side files.Use CTEs Wisely
-- PostgreSQL 12+: CTEs are inlined by default (optimization fence removed)
-- But you can force materialization when needed:
WITH active_users AS MATERIALIZED (
  SELECT id, name FROM users WHERE last_login > NOW() - INTERVAL '30 days'
)
SELECT au.name, COUNT(o.id)
FROM active_users au
JOIN orders o ON o.user_id = au.id
GROUP BY au.name;

-- Use NOT MATERIALIZED (default) to let the planner inline the CTE
WITH recent_orders AS NOT MATERIALIZED (
  SELECT * FROM orders WHERE created_at > NOW() - INTERVAL '7 days'
)
SELECT * FROM recent_orders WHERE total > 500;
Prepared Statements
-- Prepare once, execute many times (saves parsing + planning)
PREPARE get_user_orders (integer) AS
  SELECT id, total, created_at
  FROM orders
  WHERE user_id = $1
  ORDER BY created_at DESC;

EXECUTE get_user_orders(42);
EXECUTE get_user_orders(99);

-- Deallocate when done
DEALLOCATE get_user_orders;
VACUUM & Autovacuum
PostgreSQL's MVCC creates dead tuples — old row versions that no transaction can see anymore. VACUUM reclaims that space.
What Are Dead Tuples?
When you UPDATE a row, Postgres doesn't modify it in-place. It marks the old version as dead and inserts a new version. DELETE marks the row as dead without physically removing it. These dead tuples accumulate and cause table bloat.
VACUUM vs. VACUUM FULL
| Feature | VACUUM | VACUUM FULL |
|---|---|---|
| Locks | No exclusive lock — runs concurrently | Exclusive lock on the entire table |
| Space reclaimed | Marks space as reusable (doesn't shrink file) | Rewrites table, actually shrinks file on disk |
| Speed | Fast, incremental | Slow, rewrites entire table |
| When to use | Routine maintenance (via autovacuum) | Only after massive deletes when you need disk space back |
| Downtime | None | Table is locked for the entire duration |
VACUUM FULL in production unless absolutely necessary. It locks the table exclusively, blocking all reads and writes. For large tables, this can mean minutes to hours of downtime. Use pg_repack as a zero-downtime alternative.Autovacuum Configuration
-- Check current autovacuum settings
SHOW autovacuum_naptime;          -- How often autovacuum checks (default: 1min)
SHOW autovacuum_vacuum_scale_factor; -- Fraction of table that triggers vacuum (default: 0.2 = 20%)
SHOW autovacuum_vacuum_threshold;    -- Minimum dead tuples before vacuum (default: 50)

-- Formula: vacuum triggers when
-- dead_tuples > threshold + scale_factor * total_tuples

-- For a high-write table, tune per-table:
ALTER TABLE orders SET (
  autovacuum_vacuum_scale_factor = 0.05,  -- vacuum after 5% dead (not 20%)
  autovacuum_vacuum_threshold = 1000,
  autovacuum_analyze_scale_factor = 0.02  -- reanalyze stats more often
);
Monitoring Bloat
-- Check dead tuples and last vacuum time
SELECT relname,
       n_live_tup,
       n_dead_tup,
       ROUND(n_dead_tup::numeric / NULLIF(n_live_tup, 0) * 100, 1) AS dead_pct,
       last_vacuum,
       last_autovacuum
FROM pg_stat_user_tables
ORDER BY n_dead_tup DESC
LIMIT 10;
Transaction ID Wraparound
age(datfrozenxid) and ensure autovacuum is running:
-- Check how close you are to wraparound
SELECT datname,
       age(datfrozenxid) AS xid_age,
       ROUND(age(datfrozenxid)::numeric / 2147483647 * 100, 2) AS pct_to_wraparound
FROM pg_database
ORDER BY age(datfrozenxid) DESC;
Connection Pooling
Each PostgreSQL connection spawns a dedicated OS process (~5-10 MB RAM). At 500+ connections, the server spends more time on context switching than actual queries.
PgBouncer Modes
| Mode | How It Works | Best For |
|---|---|---|
| Session | Client holds a server connection for the entire session | Apps using session-level features (temp tables, prepared statements) |
| Transaction | Server connection returned to pool after each transaction | Most web apps — best balance of efficiency and compatibility |
| Statement | Server connection returned after each statement | Simple single-query workloads (no multi-statement transactions) |
Basic PgBouncer Config
# /etc/pgbouncer/pgbouncer.ini
[databases]
myapp = host=127.0.0.1 port=5432 dbname=myapp

[pgbouncer]
listen_addr = 0.0.0.0
listen_port = 6432
auth_type = md5
auth_file = /etc/pgbouncer/userlist.txt

# Pool sizing
pool_mode = transaction
default_pool_size = 20       # connections per user/database pair
max_client_conn = 1000       # max client connections to PgBouncer
max_db_connections = 50      # max server connections per database

# Timeouts
server_idle_timeout = 300
client_idle_timeout = 0Table Partitioning
Partitioning splits a large table into smaller physical pieces (partitions) that Postgres can scan independently. The planner uses partition pruning to skip irrelevant partitions entirely.
Range Partitioning (by Date)
The most common pattern. Ideal for time-series data, logs, and event tables.
-- Create the partitioned parent table
CREATE TABLE events (
  id         BIGSERIAL,
  event_type TEXT NOT NULL,
  payload    JSONB,
  created_at TIMESTAMPTZ NOT NULL DEFAULT NOW()
) PARTITION BY RANGE (created_at);

-- Create monthly partitions
CREATE TABLE events_2025_01 PARTITION OF events
  FOR VALUES FROM ('2025-01-01') TO ('2025-02-01');
CREATE TABLE events_2025_02 PARTITION OF events
  FOR VALUES FROM ('2025-02-01') TO ('2025-03-01');
CREATE TABLE events_2025_03 PARTITION OF events
  FOR VALUES FROM ('2025-03-01') TO ('2025-04-01');

-- Drop old data instantly by detaching/dropping a partition
ALTER TABLE events DETACH PARTITION events_2025_01;
DROP TABLE events_2025_01;
List Partitioning (by Category)
CREATE TABLE orders (
  id     BIGSERIAL,
  region TEXT NOT NULL,
  total  NUMERIC(10,2),
  created_at TIMESTAMPTZ DEFAULT NOW()
) PARTITION BY LIST (region);

CREATE TABLE orders_us   PARTITION OF orders FOR VALUES IN ('us-east', 'us-west');
CREATE TABLE orders_eu   PARTITION OF orders FOR VALUES IN ('eu-west', 'eu-central');
CREATE TABLE orders_apac PARTITION OF orders FOR VALUES IN ('ap-southeast', 'ap-northeast');
Hash Partitioning (Uniform Distribution)
-- Distribute evenly across 4 partitions by user_id
CREATE TABLE user_activity (
  user_id    INTEGER NOT NULL,
  action     TEXT,
  created_at TIMESTAMPTZ DEFAULT NOW()
) PARTITION BY HASH (user_id);

CREATE TABLE user_activity_0 PARTITION OF user_activity FOR VALUES WITH (MODULUS 4, REMAINDER 0);
CREATE TABLE user_activity_1 PARTITION OF user_activity FOR VALUES WITH (MODULUS 4, REMAINDER 1);
CREATE TABLE user_activity_2 PARTITION OF user_activity FOR VALUES WITH (MODULUS 4, REMAINDER 2);
CREATE TABLE user_activity_3 PARTITION OF user_activity FOR VALUES WITH (MODULUS 4, REMAINDER 3);
Partition Pruning
-- Postgres only scans events_2025_03, skipping all other partitions
EXPLAIN ANALYZE
SELECT * FROM events
WHERE created_at >= '2025-03-01' AND created_at < '2025-04-01';

-- Verify pruning is enabled
SHOW enable_partition_pruning; -- should be 'on'CREATE INDEX ON events (created_at) on the parent — PostgreSQL 11+ will automatically create matching indexes on all partitions.Configuration Tuning
PostgreSQL ships with conservative defaults designed to run on a Raspberry Pi. For a production server, you must tune these settings to match your hardware.
| Parameter | Default | Recommended | What It Controls |
|---|---|---|---|
shared_buffers | 128 MB | 25% of RAM | PostgreSQL's own page cache (most impactful setting) |
effective_cache_size | 4 GB | 50-75% of RAM | Hint to planner about OS cache size (doesn't allocate memory) |
work_mem | 4 MB | 32-256 MB | Per-sort/hash memory (careful: multiplied by concurrent operations) |
maintenance_work_mem | 64 MB | 512 MB - 2 GB | Memory for VACUUM, CREATE INDEX, ALTER TABLE |
wal_buffers | -1 (auto) | 64 MB | Write-ahead log buffer size |
max_connections | 100 | 100-200 | Use pooler for more — each connection uses ~5-10 MB |
work_mem is per-sort, per-operation, per-connection. Setting it to 256 MB with 100 connections doing complex queries could use 25 GB+ of RAM. Start low (32-64 MB) and increase for specific queries using SET LOCAL work_mem = '256MB' inside a transaction.-- Check current settings
SHOW shared_buffers;
SHOW effective_cache_size;
SHOW work_mem;
-- Change at session level (testing)
SET work_mem = '128MB';
-- Change permanently in postgresql.conf
-- Then: SELECT pg_reload_conf(); or restart the server# Use PGTune to generate settings for your hardware
# https://pgtune.leopard.in.ua/
# Input: DB version, OS type, RAM, CPU count, disk type, connection count
# Output: optimized postgresql.conf settingsMonitoring & Observability
You can't optimize what you can't measure. PostgreSQL includes powerful built-in monitoring views.
pg_stat_statements (Top Slow Queries)
-- Enable the extension (once)
CREATE EXTENSION IF NOT EXISTS pg_stat_statements;

-- Find the top 10 slowest queries by total time
SELECT query,
       calls,
       ROUND(total_exec_time::numeric, 2) AS total_ms,
       ROUND(mean_exec_time::numeric, 2) AS avg_ms,
       rows
FROM pg_stat_statements
ORDER BY total_exec_time DESC
LIMIT 10;pg_stat_statements is the single most valuable monitoring extension. It tracks every query's execution count, total time, rows returned, and buffer usage. Enable it in shared_preload_libraries in postgresql.conf and restart.pg_stat_user_tables (Table Stats)
-- Tables with the most sequential scans (missing indexes?)
SELECT relname,
       seq_scan,
       idx_scan,
       ROUND(100.0 * seq_scan / NULLIF(seq_scan + idx_scan, 0), 1) AS seq_pct,
       n_live_tup
FROM pg_stat_user_tables
WHERE seq_scan + idx_scan > 0
ORDER BY seq_scan DESC
LIMIT 10;
pg_stat_user_indexes (Index Usage)
-- Find unused indexes (candidates for removal)
SELECT schemaname, relname, indexrelname,
       idx_scan,
       pg_size_pretty(pg_relation_size(indexrelid)) AS index_size
FROM pg_stat_user_indexes
WHERE idx_scan = 0
ORDER BY pg_relation_size(indexrelid) DESC;
pg_stat_activity (Live Connections)
-- See what's happening right now
SELECT pid, state, wait_event_type, wait_event,
       query_start, LEFT(query, 80) AS query
FROM pg_stat_activity
WHERE state != 'idle'
ORDER BY query_start;
auto_explain for Slow Plans
-- Log EXPLAIN output for queries over 1 second
-- Add to postgresql.conf:
-- shared_preload_libraries = 'auto_explain'
-- auto_explain.log_min_duration = '1s'
-- auto_explain.log_analyze = true
-- auto_explain.log_buffers = true

-- Or enable per-session for testing:
LOAD 'auto_explain';
SET auto_explain.log_min_duration = '500ms';
SET auto_explain.log_analyze = true;pg_stat_statements (which queries are slow?) with auto_explain (why are they slow?) for a complete optimization workflow. Identify the top offenders first, then analyze their plans.Test Yourself
Q: What is the difference between EXPLAIN and EXPLAIN ANALYZE?
EXPLAIN shows the planner's estimated execution plan without running the query. EXPLAIN ANALYZE actually executes the query and shows real timing, actual row counts, and buffer usage. Always use ANALYZE for accurate optimization — but wrap destructive queries in a transaction + ROLLBACK.
Q: When would you use a GIN index instead of a B-tree?
Use GIN for multi-valued data: full-text search (tsvector), JSONB containment queries (@>), and array operations (&&, @>). B-tree works for single-value equality and range queries. GIN indexes are slower to build and update but much faster for "does this document/array/JSON contain X?" queries.
Q: Why is VACUUM FULL dangerous in production?
VACUUM FULL takes an exclusive lock on the table, blocking all reads and writes for the entire duration. On a large table this can mean minutes to hours of downtime. Regular VACUUM runs concurrently without locking. Use pg_repack for zero-downtime table compaction if you need to reclaim space.
Q: What does shared_buffers control and what should it be set to?
shared_buffers is PostgreSQL's own in-memory page cache — the most impactful performance setting. The recommended value is 25% of total server RAM (e.g., 4 GB on a 16 GB server). Setting it too high steals memory from the OS page cache, which Postgres also relies on via effective_cache_size.
Q: What is partition pruning and why does it matter?
Partition pruning is the query planner's ability to skip entire partitions that cannot contain matching rows. For example, querying WHERE created_at = '2025-03-15' on a monthly-partitioned table only scans the March 2025 partition, ignoring all others. This turns a full table scan of billions of rows into a scan of millions.
Interview Questions
Q: A production query that used to run in 50ms is now taking 8 seconds. Walk me through how you would diagnose and fix it.
Step 1: Get the plan. Run EXPLAIN (ANALYZE, BUFFERS) on the query. Look for Seq Scans on large tables, large row estimate mismatches, and high buffer reads.
Step 2: Check statistics. Run ANALYZE on the affected tables to update planner statistics. Stale stats cause bad plans (the planner may think a table has 100 rows when it has 10 million).
Step 3: Check for bloat. Query pg_stat_user_tables for high n_dead_tup. If autovacuum is behind, run VACUUM ANALYZE on the table.
Step 4: Check indexes. Verify the right indexes exist. A missing index after a schema change or a dropped index causes Seq Scans. Look at the plan's filter vs. index conditions.
Step 5: Check for lock contention. Query pg_stat_activity for blocked queries. Long-running transactions can hold locks and prevent autovacuum.
Q: Explain the difference between a B-tree index and a GIN index. When would you choose each?
B-tree stores sorted key values in a balanced tree structure. It excels at equality (=) and range (<, >, BETWEEN) queries on scalar values. It's the default index type and works for most columns.
GIN (Generalized Inverted Index) maps each element (word, array item, JSON key) to the rows containing it — like a book's back-of-the-book index. It excels at containment queries: "which rows contain this word/element?"
Choose B-tree for: WHERE email = 'x', WHERE created_at > '2025-01-01', ORDER BY. Choose GIN for: full-text search (@@), JSONB queries (@>), array contains (&&).
Q: When would you use table partitioning and what are the trade-offs?
Use partitioning when: A table exceeds ~100M rows, queries always filter on the partition key (usually a date), or you need to efficiently drop old data (detach partition vs. massive DELETE).
Trade-offs: Partitioning adds complexity — you must manage partition creation (often automated with pg_partman), cross-partition queries can be slower if pruning doesn't apply, and unique constraints must include the partition key. Don't partition small tables; the overhead of partition routing outweighs the pruning benefit.
Q: What is connection pooling and why does PostgreSQL need it?
Each PostgreSQL connection spawns a dedicated OS process using ~5-10 MB of RAM. At 500+ connections, the server wastes significant CPU on process context switching, shared memory management, and snapshot overhead, degrading query performance.
Connection pooling (typically PgBouncer) sits between your app and Postgres. It maintains a small pool of actual database connections (e.g., 20-50) and multiplexes hundreds of client connections across them. In transaction mode, a client only holds a server connection during an active transaction, then releases it back to the pool.
Q: What does VACUUM do and what happens if it doesn't run?
VACUUM reclaims space from dead tuples (old row versions left behind by UPDATE and DELETE due to MVCC). It marks that space as available for future inserts without physically shrinking the table file.
If VACUUM doesn't run: Dead tuples accumulate, causing table bloat (larger disk usage), slower sequential scans, and degraded index performance. In the worst case, the 32-bit transaction ID counter approaches wraparound (~4 billion), and PostgreSQL will shut itself down to prevent data corruption. Autovacuum handles this automatically, but high-write tables may need more aggressive settings.